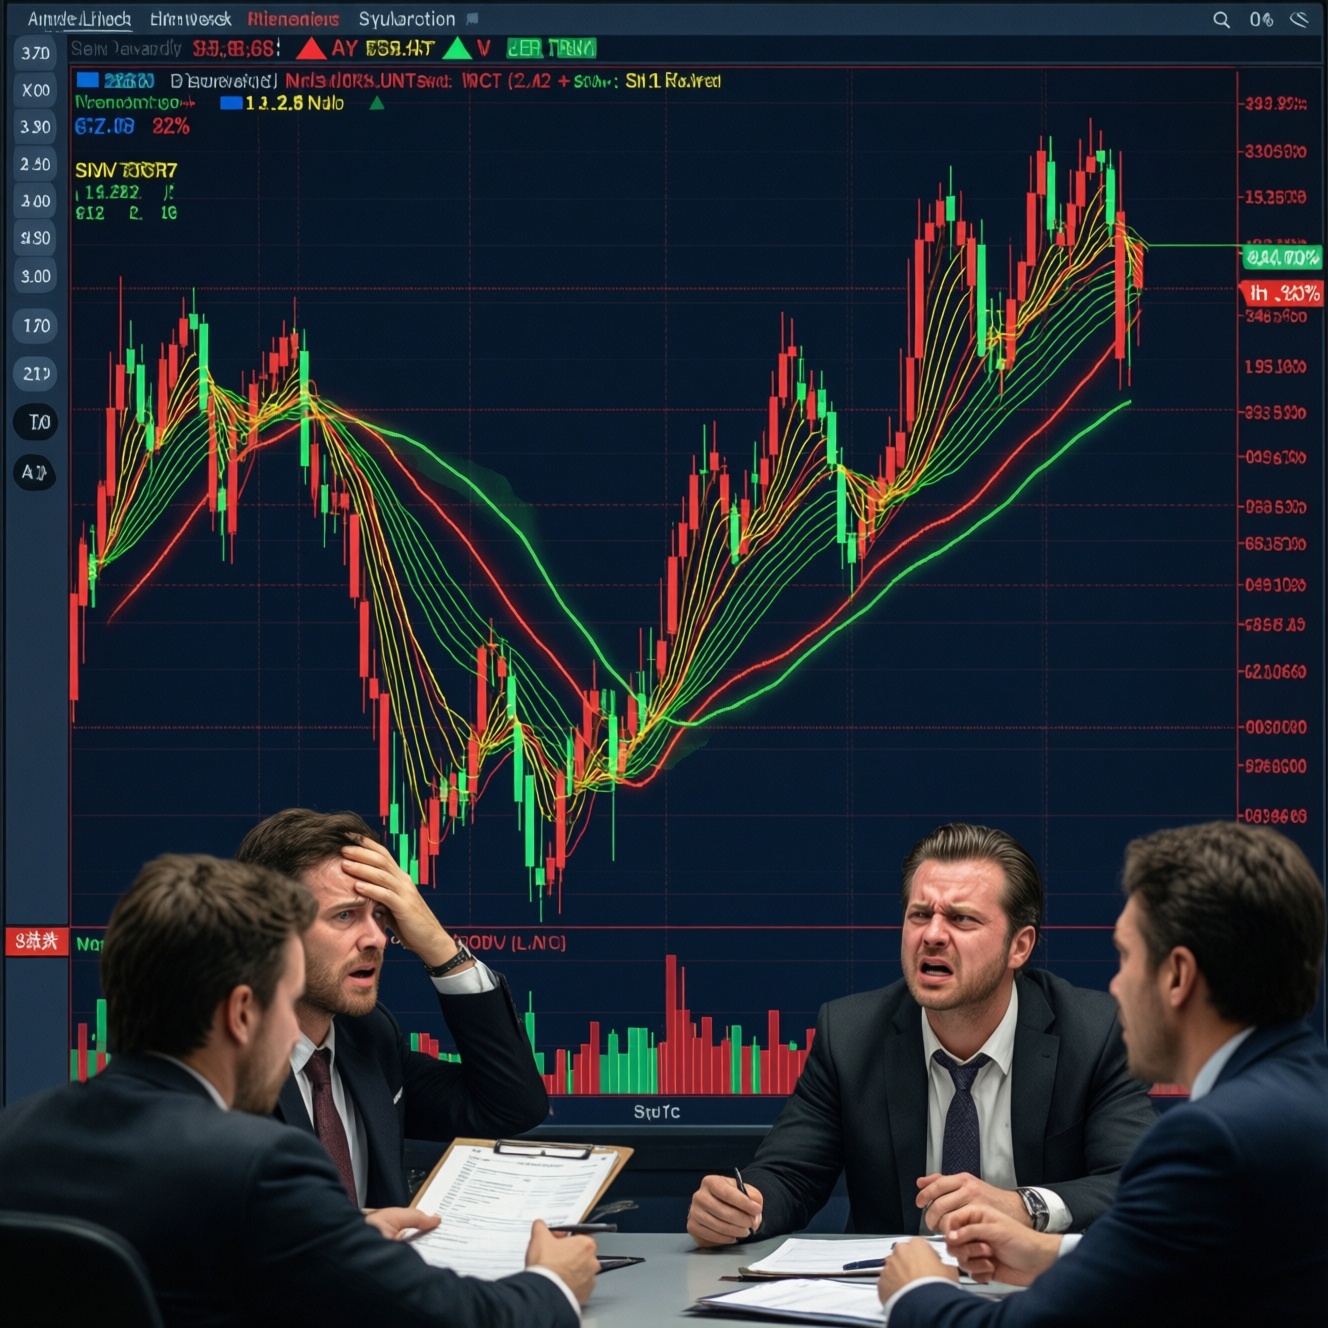
Volatility is the degree and pattern of price fluctuation, not a guarantee of loss or profit. In practice, "high risk, high reward" feels true because big price swings trigger stronger emotions, wider outcome ranges, and worse timing mistakes. If you understand what volatility meaning in stocks really captures, you can measure it, set expectations, and manage it with clearer rules.
Core Concepts Summarized
- Volatility describes variability of returns; it is not the same thing as "risk of permanent loss."
- Big swings amplify both opportunity and behavioral mistakes, making high risk high reward investments feel especially intense.
- Volatility clusters: calm periods tend to follow calm, and turbulence tends to persist.
- How to measure stock volatility depends on horizon: daily swings, multi-week dispersion, or regime shifts.
- Portfolio outcomes depend on position sizing, rebalancing, and whether you sell during drawdowns-not on volatility alone.
- "Best volatile stocks to buy" is the wrong starting question unless you first define your holding period, edge, and exit rules.
What Market Volatility Actually Measures
If you're asking what is volatility in investing, the clean definition is: volatility measures how widely returns vary around an average over a chosen time window. It describes the distribution of outcomes, not whether the average outcome is positive.
The volatility meaning in stocks is therefore contextual: a stock can be volatile because of earnings uncertainty, leverage, thin liquidity, or simply market-wide shocks. The same "high volatility" label can reflect very different fundamentals and very different trading conditions.
Concrete example: two stocks can end a month at the same price. One might have moved smoothly; the other might have whipsawed up and down. Volatility is about the path (and dispersion of returns), not just the start and end points.
Behavioral Roots of the 'High Risk, High Reward' Intuition
The "high risk, high reward" intuition often comes from how humans experience variance rather than from careful probability math. Volatility intensifies the sensation of risk and the temptation of upside.
- Salience of extremes: large up-days are memorable, so upside stories spread faster than quiet compounding.
- Loss aversion: a fast drop feels worse than a slow decline, even if the final loss is identical.
- Recency bias: a recent rally makes high volatility feel "worth it," while a recent crash makes it feel "uninvestable."
- Overconfidence in timing: investors assume they can exit before the drop, especially after a few wins.
- Variable reinforcement: unpredictable wins (like sudden spikes) can encourage repeated risk-taking.
- Anchoring to peaks: after a spike, any pullback looks like a "discount," even if valuation changed.
Volatility vs. Risk: Quantitative and Conceptual Distinctions
Volatility is a statistical description; "risk" is a goal-dependent concept. For a long-horizon investor, volatility might be tolerable noise. For a short-horizon trader or a leveraged position, the same volatility can become existential risk.
| Concept | What it describes | What can go wrong in practice | Typical fix |
|---|---|---|---|
| Volatility | Dispersion of returns over a window | Forced selling due to discomfort or margin | Right-size positions; pre-commit rules |
| Drawdown | Peak-to-trough decline | Capitulation near lows; strategy abandonment | Define max tolerable drawdown; diversify drivers |
| Permanent loss risk | Impairment of capital (business/credit dilution) | "It never comes back" due to fundamentals | Balance-sheet checks; thesis-based exits |
| Liquidity risk | Ability to exit near expected prices | Slippage during stress; gaps | Avoid crowded/thin names; use limits |
Typical scenarios where confusing volatility with risk creates bad decisions:
- Short holding periods: you need cash soon, so price swings become real life constraints.
- Leverage/margin: volatility can trigger margin calls even if the long-term thesis is correct.
- Concentrated positions: one volatile name dominates portfolio behavior and emotions.
- Income needs: withdrawals during drawdowns lock in losses.
- Thesis uncertainty: volatile price action gets mistaken for "new information."
Mini-scenarios: where the distinction changes the decision
- Long-term saver: a volatile broad equity fund may be acceptable because contributions continue and there's no forced selling.
- 6-month tuition goal: the same volatility is a true risk, because timing is fixed and downside cannot be "waited out."
- Single-stock bet: volatility can be survivable if the business is sound and sizing is small; it becomes dangerous when position size is emotional rather than planned.
Mechanics Behind Large Price Swings and Clustering
Large swings are rarely random noise alone; they usually reflect how information, positioning, and liquidity interact. Volatility clustering happens because stress changes behavior: market participants widen spreads, reduce size, and react faster to headlines.
Common drivers of outsized moves
- Information shocks: earnings surprises, guidance changes, policy headlines, geopolitical events.
- Positioning and crowded trades: when many hold the same exposure, exits become correlated.
- Liquidity gaps: fewer bids in stress leads to price "gapping" to the next level.
- Options hedging flows: hedging can add fuel to moves when prices approach key strikes.
- Stop-loss cascades: clustered stops can turn a normal move into a sharp slide.
What volatility is useful for-and where it misleads
- Useful: setting position size, estimating plausible short-term ranges, stress-testing a portfolio's behavior.
- Misleading: treating high volatility as "automatically high return," or treating low volatility as "safe" without checking valuation and fundamentals.
How Volatility Translates to Portfolio Outcomes
Volatility affects outcomes mainly through investor behavior and portfolio mechanics. The biggest gap between expected and realized results often comes from timing decisions made under stress.
- Myth: "Higher volatility means higher return." Reality: volatility widens the range; the average depends on fundamentals and entry price.
- Mistake: buying excitement instead of a plan. Searching "best volatile stocks to buy" often leads to chasing recent spikes.
- Mistake: sizing by conviction alone. High conviction with oversized exposure converts normal swings into forced actions.
- Myth: "Diversification fixes everything." It helps, but correlations can rise during stress, so you also need liquidity and sizing discipline.
- Mistake: changing rules mid-drawdown. Switching strategies during volatility clustering locks in the worst timing.
Practical Methods to Monitor and Manage Volatility
Start by measuring volatility in a way that matches your horizon, then tie it to decisions: position sizing, rebalancing bands, and explicit exit criteria. This is where how to measure stock volatility becomes practical rather than academic.
A simple monitoring workflow you can run weekly
- Pick a horizon: "trading" (short), "swing" (medium), or "investing" (long).
- Track two metrics: recent realized volatility (how much it moved) and drawdown (how deep it fell from a peak).
- Define action thresholds: what triggers a trim, a rebalance, or a full thesis review.
- Check liquidity: can you exit without large slippage in stress?
- Log decisions: write the rule you followed, not the emotion you felt.
Quick practical tips (Thailand context)
- Match volatility to cash-flow needs: if you have near-term THB obligations, keep that bucket in low-volatility instruments so you are not forced to sell risk assets.
- Prefer rules over forecasts: decide in advance whether you will rebalance (add/trim) when a position deviates strongly from target weight.
- Use position caps: limit any single volatile stock to a level where a sharp drop would not change your life plans.
- Separate "speculation" from "core": treat high volatility ideas as a small satellite allocation with predefined exits.
- Beware headline-driven spikes: if the thesis is "price is moving," you don't have a thesis.
Mini case: interpreting a choppy chart without overreacting
Imagine a stock that repeatedly surges and drops around news days, while the longer-term trend is flat. Treat this as a volatility regime: reduce position size, avoid using tight stops that get hit by noise, and require a fundamental catalyst (earnings, margin expansion, balance-sheet improvement) before increasing exposure.
Decision rule pseudo-code (for sizing, not prediction)
if (position_drawdown > your_max_drawdown) then
  reduce_position_to_core_size
else if (realized_volatility_rising and thesis_unchanged) then
  tighten_risk_by_sizing_down_not_by_panic_selling
else
  hold_and_rebalance_to_target_weight_if_needed
end
Clarifying Common Confusions About Volatility
Is volatility the same as risk?
No. Volatility is variability of returns; risk depends on your goals, leverage, liquidity, and the chance of permanent impairment.
Does higher volatility mean higher expected return?
Not reliably. Higher volatility mainly means a wider range of outcomes; expected return depends on fundamentals and price paid.
What's the simplest way to explain volatility to a stock investor?
It's how "bumpy" the ride is. Two stocks can end at the same price, but the more volatile one takes a rougher path.
How can I measure volatility without complex math?
Track typical price swings over your chosen horizon and compare them over time. Pair that with drawdown to capture downside depth.
Why do volatile periods feel like they last longer?

Volatility clusters and attention increases during stress. More headlines and faster moves make time feel stretched and decisions feel urgent.
Should beginners look for the "best volatile stocks to buy"?
Usually no. Start with a plan for sizing, exits, and holding period; only then decide whether a volatile stock fits as a small satellite position.
Can diversification eliminate volatility?
It can reduce it, but not eliminate it-especially when many assets move together during market stress.