
Volatility is the size of typical price swings around an average. Simple math shows why strategies that produce occasional "big wins" often endure long losing streaks: when payouts are rare but large, most trades are small losses, and the variance of outcomes stays high even if the expected value is positive. This is volatility explained in practical terms.
Concise overview: why volatility breeds long losing runs
- High volatility means outcomes spread widely; the "average" result is less representative of what you'll experience trade to trade.
- Rare large winners increase variance, so most sequences look like losses until the winner arrives.
- Positive expected value does not prevent long drawdowns; it only describes the long-run average.
- Streaks are a normal property of random sequences; they are not proof your edge disappeared.
- Risk management for volatile markets is mostly about surviving the streak, not predicting the next trade.
Defining volatility: variance, standard deviation and real outcomes
In trading, volatility is the dispersion of returns. If r is a return (e.g., daily % change), then the mean return is μ, the variance is Var(r)=E[(r−μ)²], and the standard deviation is σ=√Var(r). Standard deviation is "volatility" in many quantitative contexts because it's in the same units as returns.
Practically, higher σ means a wider range of outcomes around your plan: stop-losses get hit more often, profit targets are less consistent, and equity curves become "lumpier." This is why a volatility trading strategy often feels psychologically harder even when it's mathematically sound.
One quick numeric example: if a strategy's typical daily return is near 0, a day of −2% and a day of +2% both contribute (0.02)² to variance. Large swings in either direction increase volatility and make streaks more likely.
If you need a concrete answer for how to calculate volatility in a time series, the basic estimator is the sample standard deviation: σ̂=√( (1/(n−1)) Σ (rᵢ−r̄)² ). Use consistent return definitions (simple or log), and a consistent sampling interval.
Simple probabilistic model: Bernoulli bets and payout distribution
To see why "big wins" produce long losing runs, model each trade as a Bernoulli trial: a win happens with probability p, otherwise it's a loss with probability 1−p. Add a payoff size: win pays +W, loss pays −L (in R-multiples or %).
- Outcome distribution: X is either +W (probability p) or −L (probability 1−p).
- Expected value: E[X]=pW−(1−p)L. Your "edge" is positive if this is > 0.
- Variance: for two-point outcomes, Var(X)=p(W−E[X])²+(1−p)(−L−E[X])².
- Big-win profile: "Rare but large" means small p and large W, which typically increases Var(X) even if E[X] is positive.
- Streak mechanism: if p is low, the most common short sequence is multiple losses; the win is statistically "due" only in the long run, not on your schedule.
Numeric example: suppose p=0.2, W=5R, L=1R. Then E[X]=0.2·5−0.8·1=+0.2R (positive), yet 4 out of 5 trades lose on average-so losing streaks are expected behavior, not a malfunction.
How rare large payouts skew perceived performance
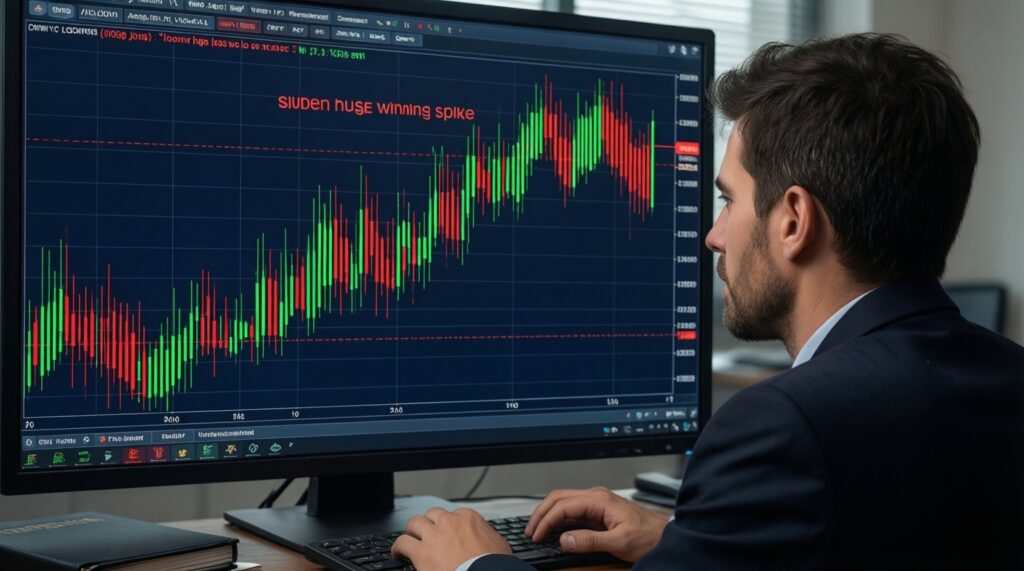
In live trading (including Thai markets where liquidity and gaps can vary by instrument), rare large winners commonly appear in setups that monetize tail moves. These setups can be profitable while still feeling "broken" most of the time because the median path is negative until a winner lands.
- Trend-following breakouts: many small stop-outs, occasional long run. If the stop is tight relative to daily noise, realized volatility dominates outcomes.
- Long volatility / convex trades: pay small costs frequently (theta/roll/slippage), then monetize big moves. This is the "insurance" shape.
- Mean reversion with crash risk: frequent small wins and rare large losses (the inverse shape). Here, volatility hides in the tail.
- Event-driven positioning: many no-event losses, rare event wins; outcomes cluster around announcements and gaps.
- Grid/martingale variants: appear smooth until volatility spikes; then the distribution reveals large downside.
Numeric example: if you pay −0.3R most weeks and occasionally gain +6R, your P&L looks bad for long stretches, then "jumps." That jump is not luck alone; it's the designed payout distribution.
Expected value vs. variance: trade-offs explained with formulas
Two strategies can have the same expected value but very different volatility. This distinction matters because your account and psychology operate on sequences, not on long-run averages. Choosing the best volatility indicator is secondary to understanding which part of the distribution your strategy depends on (frequent small wins vs rare big wins).
- What you want (long-run): maximize E[X].
- What you must survive (path): manage Var(X) and drawdowns.
- Signal quality vs payout shape: even with a stable edge, a skewed payout (rare big wins) implies larger variance and longer losing runs.
- Same EV, different pain: Strategy A: frequent small wins (higher p, smaller W). Strategy B: rare big wins (lower p, larger W). Both can share E[X], but B typically has higher variance.
- Volatility metrics are proxies: standard deviation of returns measures dispersion; indicators like ATR measure typical range. A "best volatility indicator" is the one aligned to your execution (range-based for stops, return-based for portfolio risk).
- Capacity and costs: higher variance often increases turnover or stop frequency, magnifying fees and slippage-reducing realized E[X].
Numeric example: if two systems both have E[X]=+0.2R, the one with outcomes {+5R, −1R} will usually have larger swings than {+1R, −0.6R}, even if the averages match.
Simulations and back-of-envelope calculations for streak length
You don't need complex models to anticipate streaks; a simple simulation or a rough probability check prevents overreacting. This is especially important when implementing a volatility trading strategy, because the distribution-not the narrative-drives your lived experience.
- Mistake: treating EV as a guarantee. Positive E[X] doesn't mean the next 50 trades will be profitable; it means the average tends to positive as the sample grows.
- Mistake: assuming independence when you don't have it. Volatility clusters; losing streaks can lengthen if market regimes change.
- Mistake: ignoring multiple testing. If you run many systems, at least one will show an extreme streak by chance.
- Mistake: "I haven't had a big win lately, so it's due." In independent trials, the probability of the next win remains p regardless of past losses.
- Mistake: confusing indicator volatility with strategy volatility. Price volatility can be stable while strategy outcomes are volatile (and vice versa), depending on stop/target structure.
Back-of-envelope check: the probability of k losses in a row (under independence) is (1−p)^k. With p=0.2, the probability of 10 consecutive losses is 0.8^10, which is not astronomically small-so seeing it at some point over a long career is plausible.
Minimal simulation outline (pseudocode) for intuition:
p = 0.20
W = 5   # win in R
L = 1   # loss in R
equity = 0
maxLossStreak = 0
lossStreak = 0

for t in 1..N:
    u = randomUniform(0,1)
    if u < p:
        equity += W
        lossStreak = 0
    else:
        equity -= L
        lossStreak += 1
        maxLossStreak = max(maxLossStreak, lossStreak)

print(equity, maxLossStreak)
Practical risk management: position sizing and smoothing returns
The practical objective is to size positions so that the inevitable losing streak is survivable. In risk management for volatile markets, you control exposure (position size), not outcomes. Keep your risk per trade small enough that a plausible streak doesn't force you to stop trading or change rules midstream.
- Choose a risk unit (R): define 1R as the loss if the stop is hit.
- Set a streak tolerance: decide how many consecutive losses you can absorb operationally (margin, psychology, mandates).
- Derive position size from stop distance: PositionSize = (AccountRiskPerTrade) / (StopDistance) (in units/THB notional as appropriate).
- Volatility-adjust stops: if typical range expands, widen the stop and reduce size to keep R constant (range-based logic often aligns better than fixed ticks).
- Smooth exposure: scale in/out or cap total portfolio risk so multiple correlated positions don't create one giant bet.
Numeric example: if you risk 1R per trade and expect that a streak of 10 losses could happen, then your plan must withstand ~10R drawdown without forcing liquidation. If that's too large for your account, reduce R (or redesign the payoff profile) before going live.
Implementation sketch (position sizing):
account = 100000  # THB example account value
riskPct = 0.005   # 0.5% per trade
riskTHB = account * riskPct

stopDistanceTHB = entryPrice - stopPrice  # absolute THB move per unit
positionUnits = riskTHB / stopDistanceTHB
Clarifying common misunderstandings about volatility and streaks
Does high volatility always mean higher risk?
Not if position size adjusts. Risk is exposure times volatility; you can keep risk stable by scaling down when volatility rises.
Is a long losing streak proof my edge is gone?
No. For low win-rate, big-win systems, long streaks are statistically normal; you need a separate process to detect regime change.
What is the simplest way to calculate volatility for trading?
Compute the standard deviation of returns over a fixed lookback: σ̂=√( (1/(n−1)) Σ (rᵢ−r̄)² ). Keep the timeframe consistent with your holding period.
What is the best volatility indicator?
There isn't a universal best volatility indicator. Use return standard deviation for portfolio risk and range-based measures (e.g., ATR-like logic) for stops and position sizing.
Can a positive expected value strategy still blow up?
Yes, if leverage or position sizing is too aggressive. A positive E[X] does not prevent path-dependent ruin under large variance.
Is "being due for a win" a valid expectation?
No. Under independence, the next-trade win probability stays p regardless of past losses; streaks don't create a debt the market must repay.
How does a volatility trading strategy change my execution?

It shifts focus from prediction to exposure control: wider stops, smaller size, and stricter caps on total risk so you can hold through noise and wait for convex payoffs.