
A slot paytable is the rulebook that converts symbols into payouts, and it largely determines a game's risk profile: how often you win, how big wins can be, and how swingy the balance feels. By reading symbol tiers, special symbol rules, and line/ways aggregation, you can infer volatility drivers and avoid common misreads quickly.
Paytable essentials: how symbol payouts determine game behavior
- Low symbols usually drive frequent small returns; high symbols and rare combos drive volatility.
- Wild/scatter rules often matter more than the base symbol list for risk.
- Payline/ways architecture changes how often "some win" occurs, even with identical symbol payouts.
- RTP is not a payout guarantee; volatility is not "good" or "bad"-it's a distribution shape.
- Most misreads come from confusing "pays anywhere" with paylines, and from ignoring multipliers/caps.
Decoding symbol hierarchies: value tiers and their consequences
When you see slot paytable explained correctly, focus on the hierarchy: low-tier symbols (often card ranks) typically pay for shorter matches and appear more often; high-tier themed symbols tend to require longer matches and appear less often. This tiering is the first clue to the game's variance because it determines whether returns are "dripped" frequently or concentrated into rare events.
Symbol payouts are usually quoted as a multiple of the bet unit (e.g., "5 of a kind pays 50×"), but the paytable rarely tells you the symbol probability. What it does tell you is the relative payout slope: how quickly rewards ramp from 3→4→5 matches. A steep slope (e.g., 3=1×, 4=5×, 5=100×) concentrates value into rare hits and is a classic contributor to higher volatility.
Boundaries to keep straight: a paytable defines payout mapping (what you get if a pattern happens), not hit frequency (how often patterns happen). The latter depends on the reel/virtual reel mapping and feature triggers, which are usually separate from the visible paytable.
Hit frequency versus payout size: interpreting volatility from payouts
- Look for payout concentration. If most of the "meaningful" returns sit at the top (5/6+ matches, full-screen, max symbols), expect more swinginess: this is the practical link between slot symbol payouts and volatility.
- Check the minimum paying combination. If 2-symbol or 3-symbol wins are common (especially in ways games), you may see many small wins that can still be net losses after the bet.
- Scan for "dead zones." Some high symbols only pay at the maximum length; that increases reliance on rare alignment, pushing risk upward.
- Compare slopes across tiers. If low symbols ramp slowly but high symbols ramp extremely fast, the base game tends to feel "flat" until spikes land.
- Find feature-weighted value. If the base paytable looks modest but features add multipliers/extra reels, the volatility may be feature-driven rather than symbol-driven.
- Identify caps and ceilings. Any "max win" cap compresses tail risk; missing it is a common interpretive error.
Quick method: how to read a slot paytable without overthinking

- List the top 3 payouts in the entire paytable (including feature multipliers if stated).
- Find the smallest paying win and note whether it's on paylines or "anywhere" (ways).
- Check wild/scatter pages for substitutions, multipliers, and whether wins can stack in one spin.
- Look for statements like "wins are multiplied by bet," "wins are not added," "highest win only," or "max win."
- Decide whether value is mostly in base symbols or locked behind bonus triggers.
| Paytable pattern you see | What it usually implies | Fast check to avoid a wrong read |
|---|---|---|
| Very steep top-symbol slope (e.g., 4→5 jumps massively) | More payout concentration; higher swing potential | Confirm whether wilds/multipliers make those top hits realistically reachable |
| Many small pays (2/3-of-a-kind) in ways | More frequent hits, not necessarily profit | Mentally separate "hit rate" from "net session outcome" |
| Big numbers only shown inside bonus/free spins page | Feature-driven volatility | Check trigger conditions and whether bonus wins use different reels |
Role of special symbols and modifiers: wilds, scatters, multipliers explained
- Wild substitution with exceptions. A wild may not substitute for scatters/bonus icons; assuming it does is a top mistake that overestimates hit frequency.
- Expanding/sticky wilds. These can convert medium outcomes into large ones by increasing effective match length; always check whether expansion applies only in free spins.
- Wild multipliers. If wilds multiply line wins (2×/3×), variance increases because the same symbol hit can scale; verify whether multipliers stack.
- Scatter pays anywhere. Scatters often pay regardless of lines/adjacency, which changes the "base game safety net"; confirm if scatter wins are added on top of line wins.
- Bonus symbol triggers with different math. A bonus can move the game into a different mode (different reels, added multipliers, persistent collectors), meaning the base paytable alone understates risk.
Payline architecture and win aggregation: mechanics that shape outcomes
- Paylines: Wins depend on specific line paths; more lines typically means more "small hits," but the paytable may pay per-line, so your total bet rises with line count in many games.
- Ways (all-ways): Wins can occur on any adjacent reels; this often increases hit frequency and reduces the feeling of "dry spells," but can also produce many low-value wins.
- Cluster pays: Connected groups pay; volatility depends heavily on cascade rules and how often the grid refills into chain reactions.
- Win aggregation rule: Some slots add all line/way wins; others pay "best win only" for a given spin/path-confusing these changes perceived value materially.
- Simultaneous wins: If scatters pay while lines pay, or if multiple ways can hit at once, outcomes become more variable; confirm stacking rules in the paytable text.
- Bet scaling: A paytable might quote payouts as "× line bet" or "× total bet." Mixing these up is a frequent prevention-worthy error.
Quantitative measures from paytables: RTP, variance and expected value
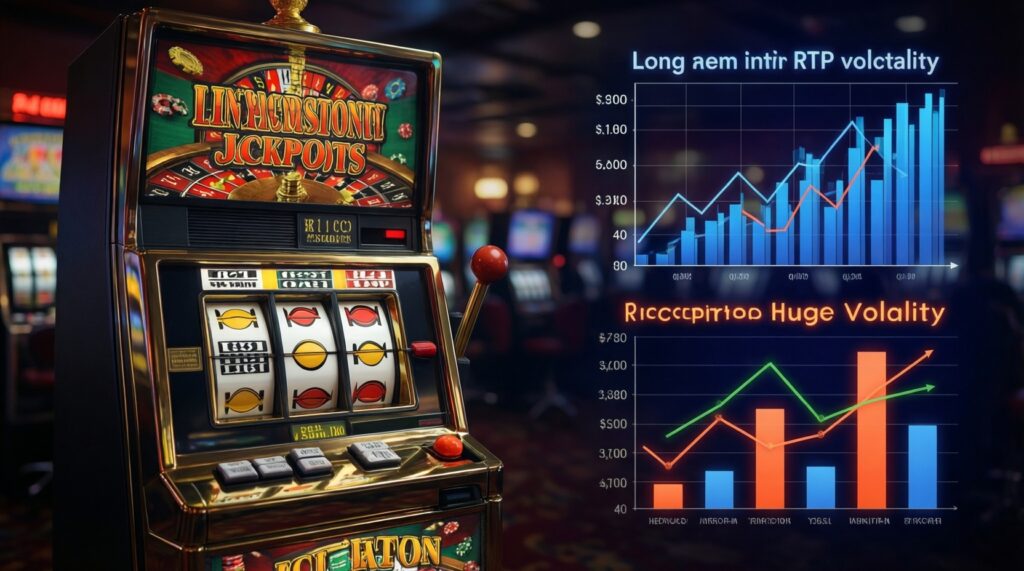
- Mistake: treating RTP as a short-session promise. Slot paytable RTP and volatility are related but different: RTP is a long-run average return; volatility describes dispersion around that average.
- Mistake: "bigger top prize = higher RTP." A larger max win can exist at many RTP levels; without probabilities, a paytable alone cannot determine RTP.
- Mistake: ignoring where EV is allocated. If much of the expected value sits in rare bonus outcomes, the base game can feel harsh even if the published RTP (when available) is competitive.
- Mistake: reading payout tables without normalizing by bet definition. Always restate payouts as × total bet (or × line bet) before comparing two games.
- Mistake: using "volatility labels" without evidence. "Low/medium/high" is often a marketing label; confirm by looking for payout concentration, feature multipliers, retriggers, and win stacking.
If you need a quick mental model for expected value, use: EV ≈ Σ(payout × probability). The paytable provides payouts, but probabilities are usually hidden; use it to compare shape (concentrated vs distributed), not to compute a precise EV.
Design trade-offs: crafting risk profiles to meet player segments
Consider two hypothetical designs with the same base symbol set but different paytable emphasis. Design A spreads value across many mid-tier wins; Design B compresses value into rare top-symbol + multiplier events. Design B is what players often call a high volatility slots paytable, even if both games could theoretically share the same RTP.
# Pseudocode: same RNG outcomes, different payout mapping (paytable)
if hit == "mid_symbol_4oak":
    payout = 8x   # Design A
    # payout = 2x # Design B
elif hit == "top_symbol_5oak":
    payout = 80x  # Design A
    # payout = 250x # Design B
elif feature_triggered:
    payout *= feature_multiplier  # increases dispersion when it can stack/retrigger
Fast prevention rule when comparing two slots in TH (or anywhere): rewrite the top 10 outcomes you see in the paytable as "how often do I expect to see something like this?" If the answer is "mostly in bonuses," expect longer downswings even if many small base hits appear.
Self-check to prevent common paytable mistakes (30 seconds)
- I confirmed whether payouts are per-line, per-way, or per-total-bet.
- I read the wild/scatter exceptions and stacking rules (not just the icons).
- I identified where the biggest payouts live: base game vs free spins/bonus.
- I checked whether wins add together or if only the highest win is paid.
- I avoided assuming RTP/volatility from prize sizes alone.
Practical clarifications on paytable mechanics
Can I compute RTP just from the paytable?
No. A paytable lists payouts, but RTP needs the underlying probabilities (reel/virtual reel distribution and feature rates), which are usually not fully disclosed in-game.
What's the fastest clue that a game is high volatility?
Look for payout concentration: very steep top-end payouts, heavy reliance on bonus multipliers, and stacking/retrigger mechanics that create rare but huge outcomes.
Why do I "win" often but still lose balance?
Many hits can be below your total bet (e.g., 0.2× to 0.8×). High hit frequency doesn't imply profitability; it just means more frequent payout events.
Do wilds always substitute for every symbol?
No. Most games exclude scatters/bonus symbols, and some exclude premium symbols. The exceptions are stated in the paytable text.
Are scatters always independent of paylines?
Often yes (they pay anywhere), but not always. Some games use "scatter on reels 1-3" or require adjacency; the paytable specifies the rule.
What does "wins are multiplied by bet" actually mean?
It means the printed values assume a base unit and scale with your current bet definition. Confirm whether that base is line bet or total bet before comparing games.
If two games have the same RTP, will they feel the same?
No. They can have identical long-run average return but very different volatility depending on how payouts and features distribute outcomes.