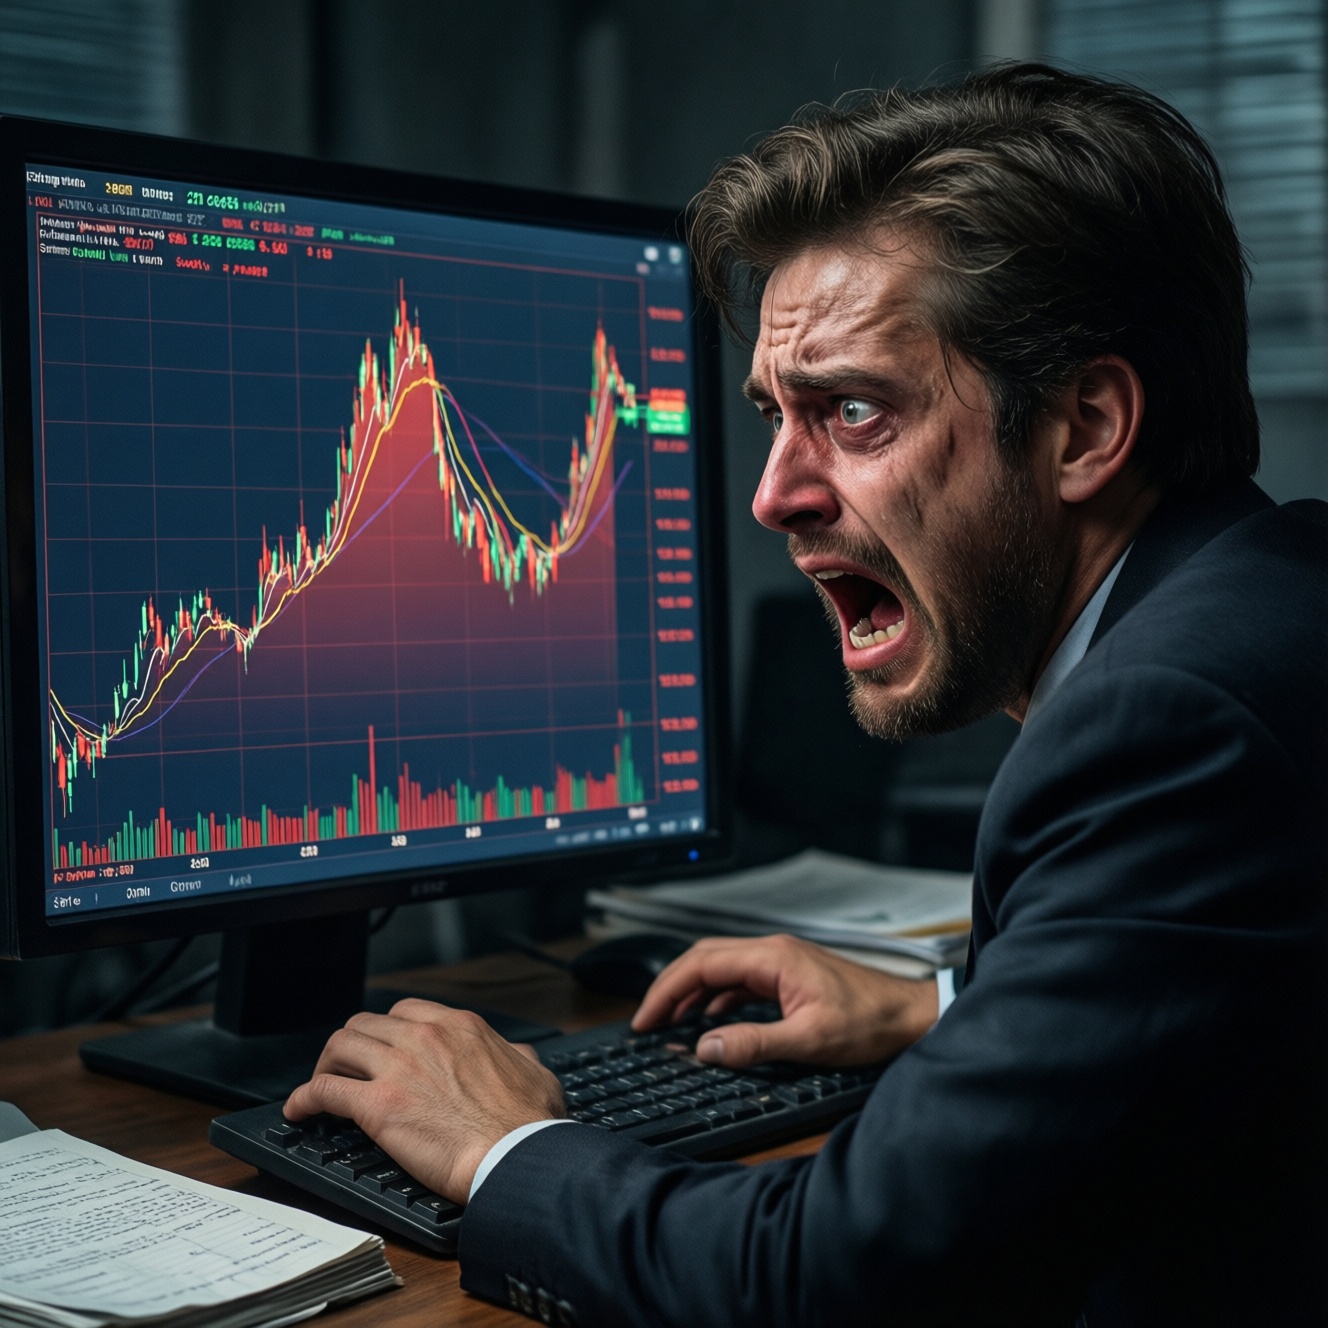
Volatility is the size and speed of price swings; it directly reshapes your equity curve by widening drawdowns, increasing variance of returns, and changing recovery time. It also pushes trader emotions toward impulsive risk-taking or risk-avoidance, causing plan drift. The practical response is to quantify volatility, then tighten risk controls and position sizing before you feel it.
Primary Effects on Capital Trajectory and Trader Behavior
- Bigger candles create deeper and faster drawdowns even with the same strategy edge.
- Wider distribution of outcomes increases streaks: more consecutive losses and occasional outsized wins.
- Stops placed "too close" get hit more often; stops placed "too far" inflate R-multiple risk.
- Slippage and gap risk increase, so realized risk exceeds planned risk.
- Emotional load rises: fear leads to premature exits; greed leads to oversizing and revenge trades.
Defining Market Volatility and How to Quantify It
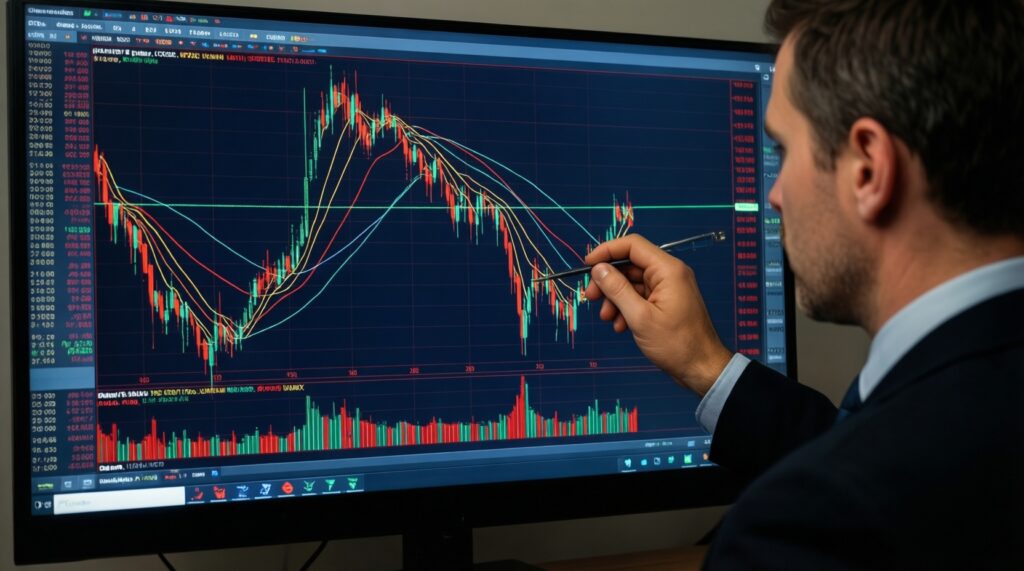
Volatility describes how much prices deviate from their average over a time window. In practice, it is not "direction" but "movement." When traders ask ความผันผวนคืออะไร เทรดหุ้น, the useful answer is: it's the regime variable that tells you how wide your price noise is relative to your stop distance and target.
Quantifying volatility lets you convert "the market feels wild" into measurable guardrails. For intermediate traders, the goal is not forecasting volatility perfectly; it's aligning risk per trade, stop distance, and trade frequency to the current regime.
Common measures fall into two buckets: realized (based on past price movement) and implied (based on option pricing). The most referenced implied proxy is the VIX; if you see เครื่องมือวัดความผันผวน VIX คืออะไร, interpret it as a market-wide fear/uncertainty gauge rather than a tradable signal by itself.
| Measure | What it captures | Best practical use | Main limitation |
|---|---|---|---|
| ATR (Average True Range) | Typical daily range including gaps | Set stop distance and position sizing in points/THB | Not normalized across price levels |
| Rolling standard deviation of returns | Dispersion of returns over a window | Compare volatility regimes across time | Sensitive to window choice; assumes stable distribution |
| VIX (implied volatility proxy) | Option-implied risk sentiment for US equities | Context for global risk-on/risk-off tone | Not a direct measure of your single-stock volatility |
- Pick one realized metric (ATR or rolling stdev) and standardize a single lookback window for your system.
- Define "normal" vs "high" volatility for your instrument using its own history, not social media.
- Write a rule: when volatility crosses your threshold, what changes (size, stops, cadence) and what stays fixed (edge logic).
How Volatility Shapes the Equity Curve: Drawdowns and Recovery
Equity curves are not only about expectancy; they are about the path your capital takes. Higher volatility increases path risk: the same average return can come with larger swings, more frequent stop-outs, and longer time-to-recover after a drawdown.
- Drawdowns deepen because adverse excursions expand; stops trigger more often unless resized.
- Variance increases, so monthly/weekly results spread out; you may see "great days" and "awful days" clustered.
- Recovery slows after large drawdowns due to reduced capital base and psychological de-risking.
- Risk-of-ruin rises if position size stays constant while ranges expand.
- Strategy fit changes: mean reversion may improve in choppy spikes; trend systems may suffer during whipsaw regimes.
- Execution drag grows: gaps and slippage mean realized losses exceed backtest assumptions.
- Track max drawdown and time-to-recovery as primary constraints, not only win rate.
- When ATR expands, re-express stops/targets in ATR units to keep risk consistent.
- Audit whether your worst drawdown weeks coincide with volatility spikes; if yes, add regime filters.
Emotional Mechanics: Fear, Greed and Decision Drift in Volatile Markets
Volatility amplifies emotion because it compresses feedback loops: you get rewarded or punished faster. The issue is rarely "emotion exists"; it is that emotion changes your decision rules without you noticing. That drift is what damages the equity curve.
- Fear-driven early exits: you cut winners when candles get larger, shrinking average win and destroying payoff ratio.
- Greed-driven oversizing: you increase size after a big win day, then give it back on a reversal.
- Revenge trading: faster losses trigger immediate re-entry without a valid setup.
- Stop editing: widening stops mid-trade to "avoid being wrong," turning a planned small loss into a large one.
- Confirmation hunting: you switch timeframes or indicators to justify a trade during noisy moves.
- Overtrading: more signals appear because price moves more, but your edge may not scale with frequency.
If you're searching for คอร์สจิตวิทยาการเทรดและการบริหารเงินทุน, use that intent practically: build pre-commitment rules (what you do before you feel fear/greed), then review violations like you would review a broken trading system.
- Define 2-3 "no-edit rules" (e.g., never widen stops; never add to losers) and keep them visible during trading.
- Use a short post-trade tag: "plan-followed" vs "plan-broken" to detect decision drift early.
- When volatility is high, reduce decision count (fewer trades) to reduce emotional exposure.
Practical Risk Controls When Volatility Rises
In high-volatility regimes, risk control is more about staying in the game than maximizing opportunity. For บริหารความเสี่ยงช่วงตลาดผันผวน, the most effective levers are simple: cap loss per trade, cap loss per day/week, and align size to current range.
What to do (actionable controls)
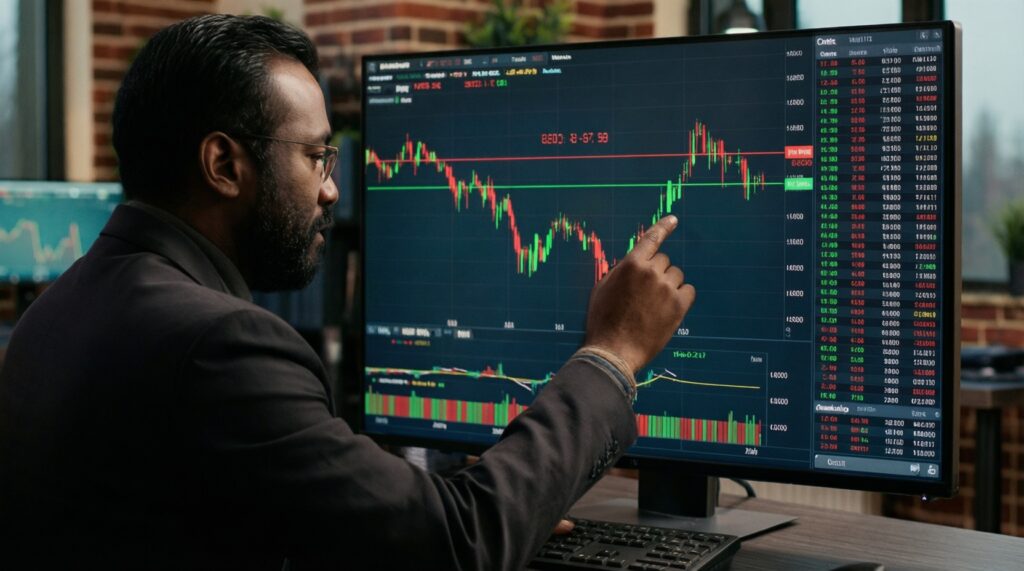
- Volatility-adjusted position sizing: keep a fixed THB risk per trade and let share size float with stop distance.
- Hard loss limits: daily stop (max loss) and weekly stop to prevent emotional spirals.
- Trade-quality filter: require cleaner structure (e.g., wider base, clearer level) before entry when ranges expand.
- Execution safeguards: use limit orders where feasible; avoid chasing breakouts after a large impulse candle.
- Correlation awareness: reduce exposure when positions are effectively the same bet (sector/market beta clusters).
What these controls cannot do (practical limits)
- They cannot eliminate gap risk; they only reduce its impact.
- They cannot guarantee smoother equity curves; they aim to keep drawdowns survivable.
- They cannot fix a negative-expectancy strategy; they only control the damage rate.
- Set three numbers in writing: risk per trade, max daily loss, max weekly loss.
- Decide a volatility trigger (e.g., ATR above your "high" threshold) that automatically reduces size or trade frequency.
- Predefine "stand aside" conditions (e.g., repeated gaps, abnormal spreads, untradeable liquidity).
Adapting Position Sizing and Trade Cadence to Volatility Regimes
Most equity-curve damage in volatile markets comes from keeping the same size and the same activity level while the environment has changed. If you're thinking เทรดช่วงความผันผวนสูง กลยุทธ์, start with adaptation rules first; only then adjust entries/exits.
- Mistake: fixed share size. When ATR doubles, your THB risk doubles unless you resize.
- Mistake: same number of trades. More movement creates more "looks," but not more edge; frequency can become noise harvesting.
- Myth: wider stop always solves stop-outs. Wider stops without smaller size increases drawdown volatility and can worsen outcomes.
- Myth: volatility means opportunity, so size up. Opportunity rises only if your edge scales; risk rises regardless.
- Mistake: changing strategy weekly. Regime shifts tempt system-hopping; you lose statistical stability.
- Resize using a single formula: position size = (THB risk per trade) ÷ (stop distance in THB).
- Reduce cadence first (fewer, higher-quality trades) before you change the strategy logic.
- Keep a "minimum sample rule" for changes: don't rewrite rules after a small streak.
Real-world Episodes: Equity Curve Responses to Volatility Spikes
Mini-case (typical): a trader risks 1R per trade with a stop set at 1 ATR. In a volatility spike, ATR expands quickly. If the trader keeps the same share size, the THB value of 1 ATR increases, so the same "1 ATR stop" becomes a larger-than-planned THB loss, and the equity curve steps down faster.
Simple rule logic (pseudo):
If ATR_today / ATR_baseline > HighVolThreshold:
    risk_per_trade = BaseRisk * 0.5
    max_trades_per_day = 1
Else:
    risk_per_trade = BaseRisk
    max_trades_per_day = 3

position_size = risk_per_trade / stop_distance_THB
The point is not the exact threshold; it's the automation of restraint. During volatility spikes, you want the equity curve to degrade slowly enough that you can keep executing the plan until conditions normalize.
- Simulate "ATR doubles" scenarios and confirm your THB risk stays within limits.
- Write a high-volatility mode that changes only size and cadence, not the whole strategy.
- Review the last 20 trades: count how many losses were "oversize due to volatility expansion."
Self-check before trading the next volatile session
- My position size is volatility-adjusted (THB risk per trade is constant).
- I have a daily/weekly loss stop and will stop trading when hit.
- I know my high-volatility trigger and what exactly changes when it triggers.
- I can name my top two decision-drift risks (early exit, revenge, stop edits) and the rule that blocks them.
Practical Clarifications Traders Ask About Volatility
Is volatility the same as risk?
Volatility is a component of risk (price variability), but risk also includes leverage, gaps, liquidity, and behavioral errors. You control risk mainly through sizing and limits, not by "predicting volatility."
Does high volatility always mean better profits?
No. It increases opportunity and error cost. Profits improve only if your edge and execution quality scale with wider ranges.
What is VIX used for in day-to-day trading?

VIX is a context indicator for broad market stress. Use it to adjust aggressiveness (size/cadence), not as a standalone buy/sell trigger for individual Thai stocks.
Should I widen stops in volatile markets?
Only if you also reduce position size so THB risk stays constant. Widening stops without resizing usually increases drawdowns.
How do I know my equity curve damage is volatility-driven or discipline-driven?
If losses cluster with volatility spikes while plan adherence stays high, it is likely regime-driven. If plan violations increase (stop edits, revenge trades), it is discipline-driven.
What is the fastest way to reduce emotional trading during volatility?
Reduce decision count: fewer trades, hard daily loss limits, and pre-committed "no-edit" rules. This lowers exposure to rapid feedback that triggers fear/greed.