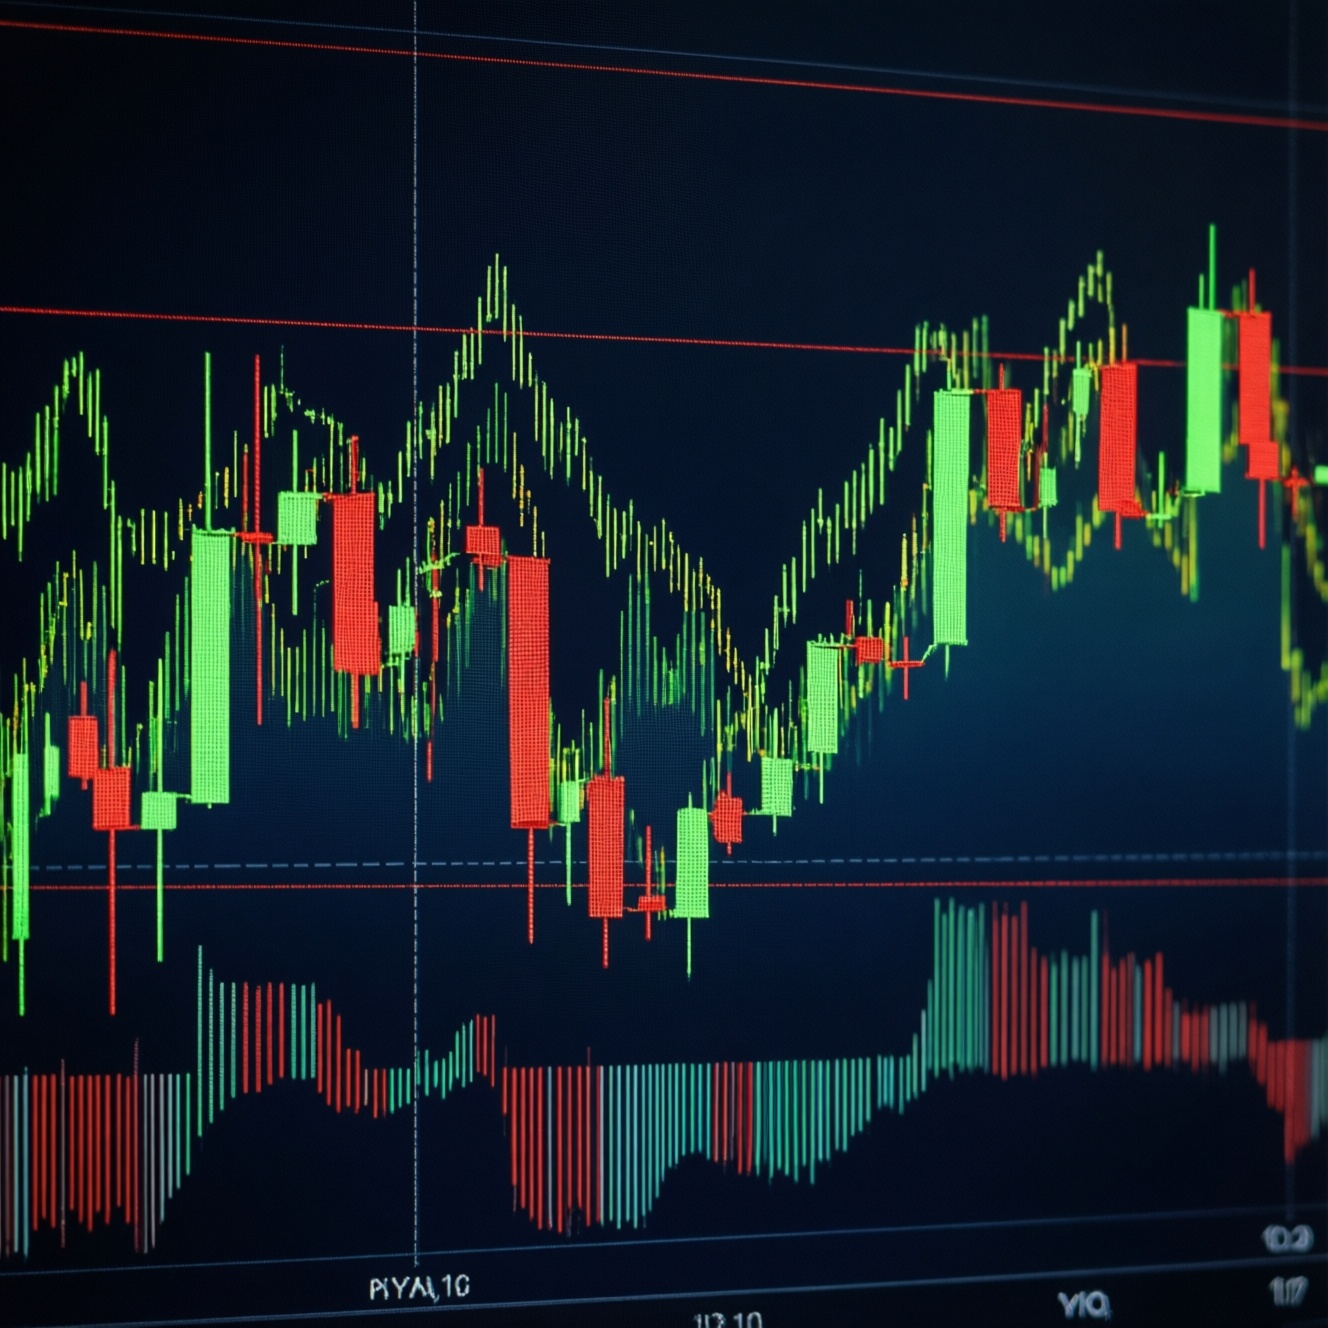
Volatility is the size and speed of price changes, not the direction. "High vol" feels stressful because outcomes spread out quickly: wider candles, faster swings, and larger drawdowns or gains in the same time window. "Low vol" feels easy because moves are smaller, but it can hide leverage buildup and sudden regime shifts.
Core concepts that shape volatility
- Volatility describes dispersion of returns; trend describes average direction.
- High volatility increases both opportunity and error cost (slippage, stops, sizing mistakes).
- Low volatility compresses ranges, often reducing risk premium until a break occurs.
- Realized volatility looks backward; implied volatility prices forward uncertainty.
- Regimes matter: the same strategy behaves differently across volatility states.
Common myths about volatility and why they mislead
Myth 1: "High vol means bearish." High volatility is compatible with rallies, crashes, and whipsaws. A market can surge and still be high vol if the path is jagged. The feeling of danger comes from larger intraday ranges and faster reversals, not from a guaranteed downtrend.
Myth 2: "Low vol means safe." Low vol often means recent price changes were small, not that future risk is small. Calm regimes can invite crowded carry, tighter stops, higher leverage, and "it always mean-reverts" beliefs-until one catalyst breaks the range.
Myth 3: "Volatility is a single number that's the same everywhere." Volatility is horizon-dependent (5-minute vs daily vs monthly) and instrument-dependent (SET50 futures vs USD/THB vs options). Treating it as one universal label leads to mismatched stop distances, wrong position sizing, and fragile expectations.
Watchpoint: Before building a volatility trading strategy, separate "how far price can move" from "where price will go."
What volatility actually measures: realized, implied and conditional views
In trading, volatility is usually modeled on returns (percentage or log changes). A simple realized-volatility estimate is the standard deviation of returns over a window, annualized: RV ≈ stdev(r) × √N, where N scales your return frequency to a year.
| View | What it is | Where it shows up | Practical use |
|---|---|---|---|
| Realized volatility (RV) | Past dispersion of returns over a chosen window | Charts, ATR, risk models, backtests | Set stop distance, size positions, compare regimes |
| Implied volatility (IV) | Volatility that makes option prices "fit" a model | Option chains, vol surface, skews | Relative value (rich/cheap vol), hedging cost, event pricing |
| Conditional volatility | Forecast of near-future volatility given current state | GARCH-style models, regime filters | Adapt rules when vol is rising/falling |
- Returns first: compute returns (simple or log), not raw prices, to compare across price levels.
- Window choice: short windows react quickly but are noisy; long windows are stable but slow.
- Scaling: annualization is a convention; your stop/target should be based on the trading horizon.
- IV vs RV gap: IV often embeds risk premium and event risk; it is not a pure forecast.
- Skew matters: downside protection can be more expensive than upside participation, shaping "feel" in stress.
Watchpoint: If you trade options, keep "options trading volatility explained" in one sentence: IV is the market price of uncertainty, not the market promise of future RV.
Behavioral fingerprints of high-volatility episodes with market examples
High-volatility regimes tend to look and feel different because microstructure and behavior change. Here are common patterns you can recognize across equities, FX, and options without relying on any single indicator.
- Range expansion and faster invalidation: your thesis gets invalidated sooner because price covers more ground per bar. Example: a breakout that "should" retest may skip the retest and run, then reverse in minutes.
- Gap risk and stop slippage: in equities and futures, news-driven gaps can jump over stops; in FX (e.g., USD/THB), liquidity pockets can widen spreads during local/off hours.
- Correlation spikes: positions that felt diversified start moving together, increasing portfolio volatility faster than expected.
- Option repricing speed: IV can jump before RV does; hedges get expensive quickly. This is where volatility index VIX trading is often used conceptually as a "risk temperature," even if you don't trade VIX products directly in Thailand.
- Whipsaw clusters: alternating large candles produce "death by a thousand cuts" for tight-stop strategies.
Watchpoint: When asking "how to trade high volatility markets," start by accepting that execution quality becomes a strategy component: entries, exits, and order types matter more than in calm regimes.
Anatomy of low-volatility regimes: why calm can be deceptive
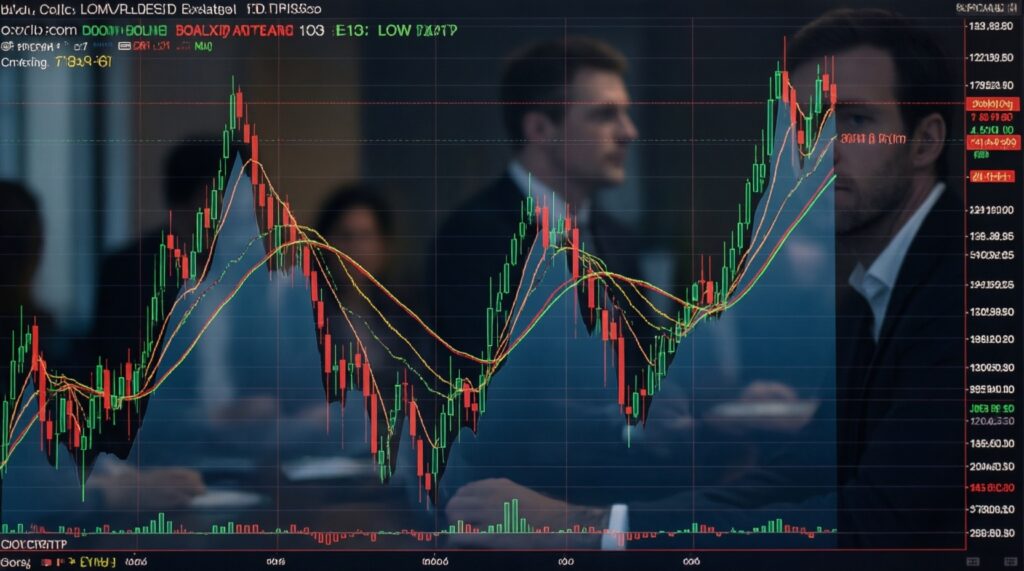
Low volatility feels comfortable because forecasting error seems smaller, but it can produce hidden fragility. The core issue is not the quietness-it's what traders do because of it.
What low volatility is good for
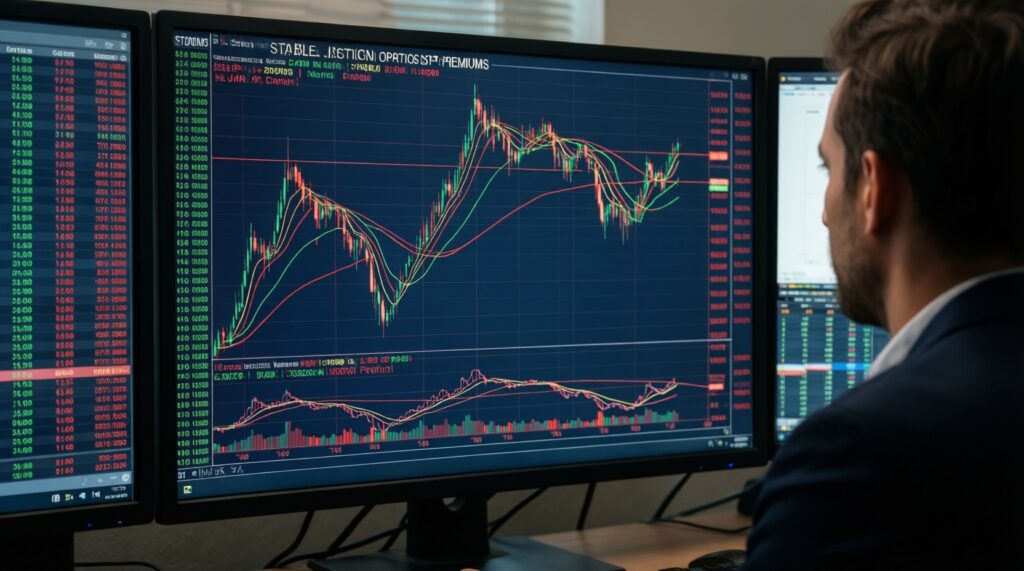
- Cleaner signal-to-noise: range boundaries and trendlines may hold longer.
- Tighter risk control: stops can be closer in absolute terms, reducing required capital per trade.
- Carry-friendly conditions: selling options or running mean-reversion may look stable when realized ranges are compressed.
Where low volatility traps intermediate traders
- Over-sizing: small recent candles tempt you to scale up, so a normal-sized shock becomes a large loss.
- Stop clustering: many participants place similar tight stops; a small push can trigger a cascade.
- False safety from indicators: ATR-based stops shrink right before breakouts, exactly when you may need more room.
- Option premium illusion: "cheap options" can stay cheap or get cheaper; time decay still works against you unless movement arrives soon.
Watchpoint: In low-vol regimes, treat leverage as the real risk variable, not the recent ATR.
From volatility to P&L: step-by-step scenario walkthroughs
The P&L impact of volatility is mostly about path: the route price takes to your target or stop. A simple sizing relation keeps you grounded: position size ≈ risk per trade ÷ stop distance. If volatility doubles and you keep the same stop distance, your effective risk usually increases.
- Scenario: same target, different vol path. In low vol, price may drift to target with small pullbacks; in high vol, it can hit your stop first even if it later reaches your target.
- Common error: using yesterday's stop in today's regime. When ranges expand, stops that worked last week become "noise magnets."
- Common error: assuming more trades = more edge. High vol can increase opportunity, but it also increases churn and fees; a volatility trading strategy must define when not to trade.
- Common error: confusing IV with certainty. If IV is high, it means the market is paying up for optionality; it does not mean direction is clearer.
- Broker reality check: The best broker for volatile markets is the one that stays stable under stress (order routing, platform uptime), offers predictable margin rules, and provides transparent spreads/commissions for the products you actually trade.
Watchpoint: If you feel "everything is random," it may be that your trade structure (stop/target/time-in-trade) is calibrated for low vol but deployed in high vol.
Practical indicators and recipes to detect regime shifts
Regime detection is about combining a few simple signals rather than hunting a perfect predictor. A practical recipe is to compare fast vs slow volatility and require confirmation from market behavior (ranges, gaps, spreads).
Quick practical tips you can apply today
- Vol-adjust everything: widen stops and cut size when vol rises; don't widen stops and keep size.
- Use two horizons: compare a short ATR (reactive) to a longer ATR (baseline) to avoid overreacting to one spike.
- Predefine execution rules: in high vol, prefer limit entries on pullbacks or staged entries; avoid market orders in thin moments.
- Separate "trade" vs "hedge": if you buy options, decide whether you want convex protection or directional exposure.
- Stress-test liquidity: if your plan fails when spreads widen, it's not ready for real volatility.
Mini-case: a simple regime flag (pseudo-logic)
- Compute ATR(14) and ATR(100) on your trading timeframe.
- Compute the ratio: R = ATR(14) / ATR(100).
- Flag high-vol regime when R stays elevated for several bars and you also see at least one of: wider spreads, more gaps, or repeated large reversal candles.
- When flagged, apply a rule set: reduce size, widen stops, lower trade frequency, and prioritize liquid sessions/products.
Watchpoint: The goal isn't to predict; it's to avoid running a low-vol playbook during a high-vol week.
Practical questions traders and analysts raise
Is volatility the same as risk?
Volatility is one measurable component of risk (dispersion of outcomes). Risk also includes gaps, liquidity, leverage, and tail events that volatility estimates may miss.
Why does high volatility feel harder even when I'm right about direction?
Because the path is rougher: larger pullbacks can hit your stop before the move resumes. High vol also increases execution error through slippage and wider spreads.
How do I trade high volatility markets without getting chopped up?
Cut position size, widen stops to match the new range, and reduce frequency until your setups become selective again. Make execution rules part of the plan, not an afterthought.
Options trading volatility explained: what should I watch first, IV or RV?
Watch both: RV tells you what happened, IV tells you what protection costs now. The gap between IV and your expectation of future RV is where option decisions live.
Is volatility index VIX trading necessary to benefit from volatility?
No. You can express volatility views via position sizing, option structures, or choosing when to trade. VIX-based products are just one specialized route and may not be accessible or suitable for every Thailand-based trader.
What makes the best broker for volatile markets in practice?
Operational reliability, transparent margin policy, and consistently tight execution on the instruments you trade. A broker that performs well in calm markets but degrades during spikes is a hidden risk.