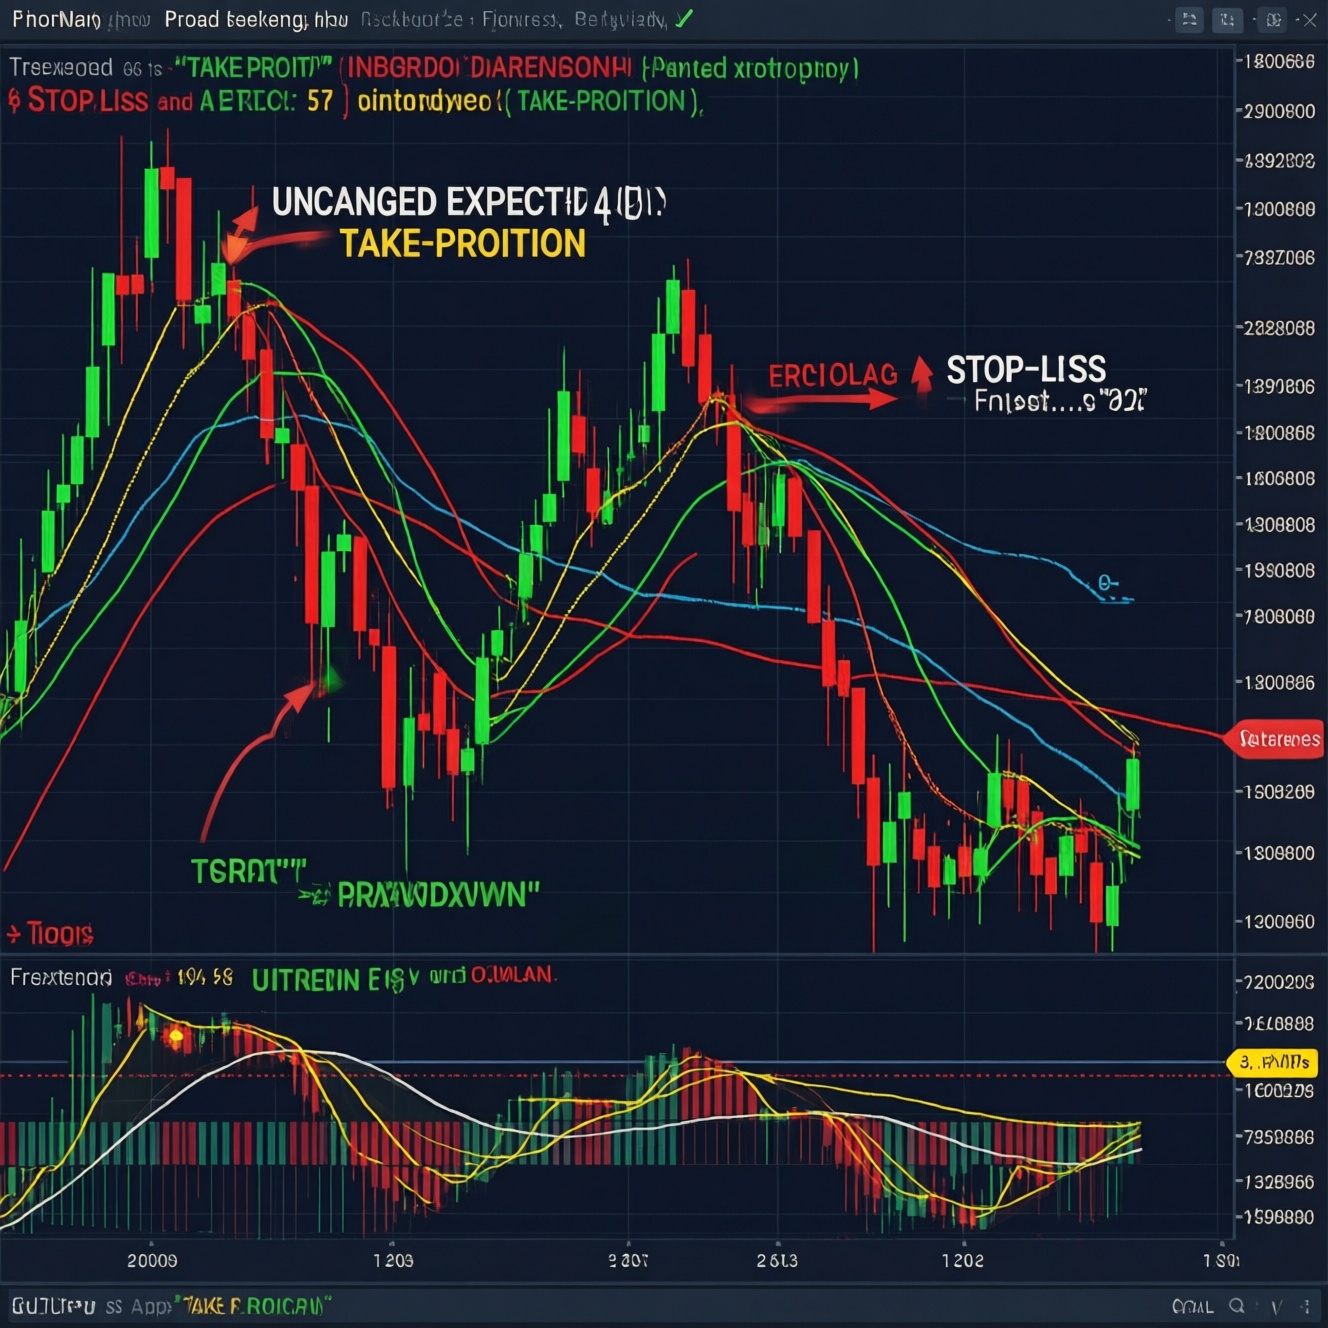
Stop-loss (SL) and take-profit (TP) usually do not change a strategy's underlying expected value (EV) if they simply encode the same exit logic you would follow manually. They mainly change your experience: the distribution of outcomes, drawdowns, and time-in-trade. EV changes only when SL/TP modify fills, costs, or payoff structure.
Bottom-line summary: Do SL/TP alter expected value
- If SL/TP only automate your planned exits, then EV stays the same; your variance and drawdown path change.
- If SL/TP force earlier exits than your edge requires, then EV can drop even if win rate rises.
- If SL/TP reduce catastrophic losses or prevent "hold-and-hope," then realized results often improve even when theoretical EV is unchanged.
- If fees, spread, slippage, or partial fills increase because of tight stops/limits, then EV can deteriorate.
- If TP caps upside in positively skewed systems (trend/momentum), then EV often decreases.
- If SL defines risk per trade and position sizing, then risk-adjusted performance can improve without changing raw EV.
Myths first: Common misconceptions about stop-loss, take-profit and EV

Myth 1: "Adding a stop-loss makes a losing strategy profitable." If your entries have no edge, an SL mostly truncates losses but also truncates recoveries; the average outcome doesn't magically flip. If your EV is negative before costs, then tighter exits often just make losses smaller and more frequent.
Myth 2: "A take-profit increases EV because you lock gains." A TP locks gains, but it also removes the right tail. If your edge comes from occasional large winners, then a TP can reduce EV while making the equity curve feel smoother.
Myth 3: "EV equals win rate." EV depends on both probabilities and payoffs. If you push win rate up by taking small profits and accepting occasional large losses, then EV can worsen.
Myth 4: "There is one best stop loss and take profit strategy." The "best" depends on the payoff distribution your entry produces, the market microstructure, and your constraints. If two traders use the same entries but different exits, then they can have similar EV but very different drawdowns and psychology.
What expected value means in trading and how to measure it
Expected value is the average outcome you would expect per trade over many repetitions, given your distribution of wins and losses (including costs). In stop loss take profit trading, EV is not a feeling about safety; it's a property of probabilities and payoffs.
- If you can label outcomes (win/loss/flat), then estimate win rate and average win/average loss in the same units (R, points, or currency).
- If you use R-multiples, then define 1R as the distance from entry to SL (your planned risk per trade).
- If your system has more than two exit types (TP hit, SL hit, time exit, discretionary exit), then compute EV as a weighted average across all exit buckets.
- If you want a quick check, then use: EV ≈ (P(win) × AvgWin) − (P(loss) × AvgLoss) − Costs.
- If you backtest, then measure EV on net results that include spread/commission assumptions consistent with your venue in Thailand (TH) context.
- If you compare variants, then keep entries fixed and change only SL/TP rules; otherwise you are mixing causes.
| Concept | What it describes | What SL/TP mostly change | What can truly change EV |
|---|---|---|---|
| Theoretical EV | Average outcome implied by probabilities/payoffs | Usually nothing if SL/TP match the same exit logic | Different payoff rules, altered fill quality, different costs |
| Realized P&L path | Sequence of wins/losses you actually experience | Drawdowns, variance, trade duration, win/loss mix | Execution, discipline, liquidity, platform behavior |
How stop-loss and take-profit reshape outcome distributions without changing probabilities
SL and TP change how outcomes are distributed even when the underlying edge (conditional drift after entry) is the same. If you keep the same entries and the same "true" market process, then changing exits mainly reshapes the left tail/right tail and time exposure.
- Range mean-reversion: If price tends to revert after your entry signal, then a closer TP can increase win rate while reducing average win; EV may stay similar, but you'll experience more small wins.
- Trend following / breakout: If your edge relies on rare extended moves, then a fixed TP often clips the right tail; EV can fall even though your hit rate looks "better."
- Volatility expansion: If volatility spikes after entry, then tight SLs get hit by noise; the distribution shifts toward more small losses, and your experience becomes "death by a thousand cuts."
- Time-based exit overlay: If you add a time stop (exit after N bars) without changing entry, then you reduce exposure time; your experience becomes less volatile, but you may truncate slow-developing winners.
- Scaling out: If you take partial profit at TP1 and let the rest run, then you blend two distributions: frequent small realizations plus occasional large wins.
Numeric example (distribution shift, not heavy math): If your entry historically produces either a +2R move (sometimes) or a -1R move (otherwise), then adding a TP at +1R converts some +2R outcomes into +1R outcomes. If the probability of reaching +2R after reaching +1R is meaningful, then your experience improves (more wins) but the average per trade can drop.
When SL/TP actually alter theoretical EV: fees, slippage, fills and asymmetric payoffs
EV changes when SL/TP change the payoff function or the effective probabilities through execution. In real markets, execution is part of the system, not an afterthought.
- If your stop is marketable in fast moves, then slippage increases; the effective loss is worse than planned 1R, lowering EV.
- If your TP is a limit order in thin liquidity, then you may not get filled; realized wins shrink or turn into scratches, lowering EV.
- If you trade instruments with wide spread relative to your SL/TP distance, then costs dominate; EV can turn negative even if gross EV looked positive.
- If your broker/exchange uses different order priority rules, then identical SL/TP logic can yield different fills; EV differs across venues.
- If your TP caps upside in a positively skewed strategy, then EV drops because you remove the rare large winners that pay for many small losses.
- If your SL is placed at a "noise" level rather than an invalidation level, then EV drops because you exit many trades that would have worked.
- If your SL is the only thing preventing ruin in leveraged products, then EV becomes meaningful in practice because without an SL your distribution includes catastrophic tails (your account cannot realize long-run EV).
Numeric example (execution): If you plan a -1R stop but typical slippage turns it into -1.2R during spikes, then your average loss increases. If nothing else changes, then EV decreases by the extra 0.2R weighted by how often it happens.
Risk management, position sizing and the bridge between expectancy and realized P&L
Many traders confuse EV with "I feel safe." Risk management makes EV survivable and repeatable. In risk management stop loss take profit, the SL is often less about predicting and more about standardizing risk so the edge can compound.
- If your SL distance changes trade-to-trade but your position size stays fixed, then your R is inconsistent and your EV estimate becomes noisy and misleading.
- If you widen SL without reducing size, then you increase tail risk; you may not survive long enough to realize the strategy's EV.
- If you move SL further away to avoid being stopped out, then you often convert many -1R losses into fewer but larger losses; EV can worsen even if the win rate improves.
- If you "take profit because it feels good," then you risk systematically cutting winners and leaving losers unmanaged; the payoff asymmetry flips against you.
- If you rely on a stop loss take profit calculator, then treat it as arithmetic (position sizing and R mapping), not as a generator of edge.
Numeric example (position sizing): If you risk a fixed 1,000 THB per trade and your SL is 10 points away, then your size is 100 THB/point. If your SL is 20 points away, then your size should be 50 THB/point to keep risk constant; otherwise you silently double risk and distort realized outcomes.
Practical frameworks to set SL/TP that preserve or improve long-term EV

Use "if..., then..." rules so your exits reflect the hypothesis behind the entry. This is the most practical way to decide how to set stop loss and take profit without accidentally destroying the edge.
- If your entry thesis has a clear invalidation level, then place SL beyond it (not at a random distance). If the thesis is invalidated, then you want to be out quickly; if it is not, then you want to avoid noise stops.
- If the market regime is high-volatility, then widen SL and reduce size so that 1R remains constant in money terms.
- If your strategy depends on fat-tail winners (trends), then avoid fixed TPs; use a trailing exit or condition-based exit so the right tail remains available.
- If your strategy is mean-reversion in a stable range, then consider a nearer TP and a time stop; your edge is often in fast snap-backs, not long holds.
- If your fills are inconsistent, then prefer rules that reduce sensitivity to microstructure (e.g., slightly wider stops, fewer "at-the-touch" limits) and re-check EV net of costs.
- If you need a starting point, then map everything in R: define SL = 1R, test TP variants in R (0.5R, 1R, 2R, trail), and keep position sizing anchored to 1R risk.
Mini-case (simple, one pass): Suppose you trade a breakout that either fails quickly or runs. If you set SL at -1R (below the breakout level) and test two exits: (A) TP at +1R, (B) trail after +1R. If (A) produces many +1R wins but few larger wins, while (B) keeps some small wins and occasionally captures +3R to +5R, then (B) can preserve the positive skew that often drives breakout EV.
Operational pseudocode (exit logic): If price hits invalidation, then exit (SL). If price reaches +1R, then move to a trailing rule (e.g., trail behind structure/ATR proxy) rather than a hard TP. If volatility doubles, then cut position size so 1R in currency stays constant.
Trader doubts clarified about SL/TP effects
Do stop-loss and take-profit change EV by themselves?
If SL/TP only automate the same decisions you would have taken consistently, then they usually don't change EV; they change the distribution and your discipline.
Why does my win rate improve with a take-profit but my account stagnates?
If TP is too close, then you may be selling winners early and leaving losses roughly unchanged, so average win shrinks more than win rate rises.
Is there a single best stop loss and take profit strategy for all markets?
No. If the entry produces trend-like payoffs, then fixed TPs often hurt; if the entry is mean-reversion, then structured TPs can help.
How tight should I set my stop-loss?
If the stop sits inside normal noise, then you'll pay for frequent small losses; if it sits beyond invalidation with proper sizing, then you preserve the entry thesis without oversized risk.
Can a stop loss take profit calculator tell me what to use?

If you use it for position sizing and converting distances into R and currency risk, then it's useful. If you expect it to create edge, then it will mislead you.
Do fees and slippage matter more with SL/TP?
If your SL/TP distances are small relative to spread and typical slippage, then costs can dominate and EV can flip negative even when the chart logic looks fine.
What's the simplest way to link EV to risk management stop loss take profit?
If you standardize 1R risk per trade via SL-based sizing, then your EV estimate becomes comparable across trades and your realized drawdowns become controllable.