Bonus frequency describes how often a bonus event occurs, while bonus value describes how much it pays when it happens. In slot-style systems, hit rate and trigger probability quantify frequency, and expected return (RTP-style) quantifies long-run value. Understanding these links lets you tune player experience, economics, and perceived generosity without guessing.
Core Concepts at a Glance
- Bonus frequency vs bonus value is a design trade: more frequent bonuses usually require smaller average payouts to keep the same long-run return.
- Slot hit rate meaning: the probability that a spin results in any win (or a defined win category) over a large sample.
- Trigger probability is narrower than hit rate: it measures how often a specific feature (free spins, pick bonus, respin) starts.
- Expected return combines frequency and value: return is the weighted average of outcomes across base game and bonuses.
- Triggers can be randomized, event-based, or time-based; each has different fairness and UX implications.
- Monitoring needs separate telemetry for hits, triggers, bonus payouts, and session-level variance.
Defining Bonus Frequency and Bonus Value
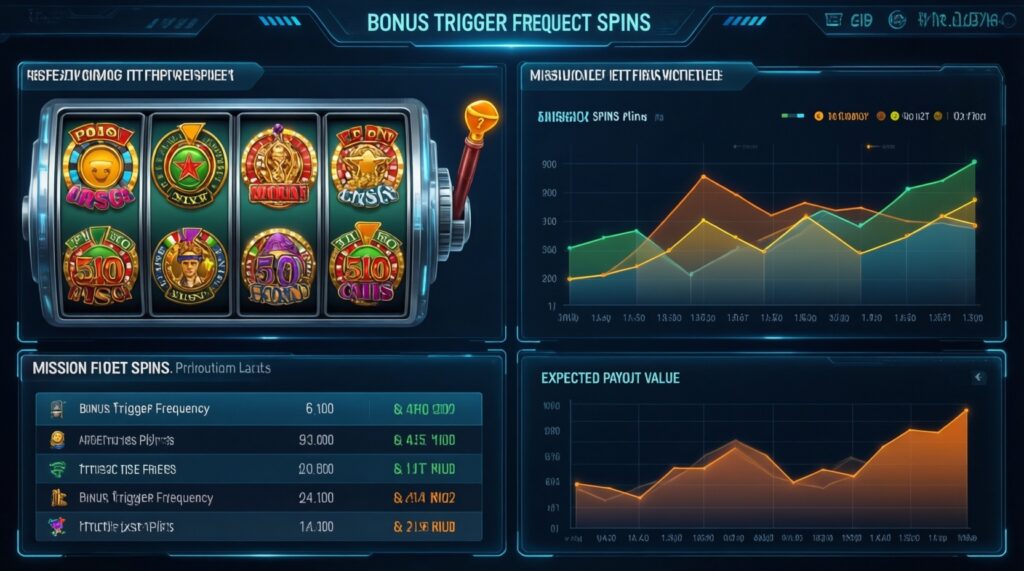
Bonus frequency is how often a specific bonus feature triggers per eligible opportunity. In a spin-based game, it's typically expressed as triggers per spin (or 1 in N spins). In a mission-based game, it may be triggers per completed task or per session.
Bonus value is the expected payout conditional on the bonus triggering. Practically, teams track it as average bonus payout in credits/coins, in bet-multiples (e.g., "x bet"), or as incremental return contributed by the bonus module.
They must be defined with the same unit of opportunity. Mixing "per session" frequency with "per spin" value creates misleading conclusions and unstable tuning.
For product decisions, treat frequency as a cadence lever (how often excitement happens) and value as an impact lever (how big that excitement is when it arrives).
Measuring Hit Rate: Metrics and Calculation
Hit rate, trigger rate, and related measures are simple ratios, but correctness depends on precise counting rules.
- Define the denominator: eligible spins/events only (exclude paused states, tutorial steps, or non-wager spins if they are economically different).
- Define the numerator:
- Hit: any win above 0 (or above a threshold you specify).
- Bonus trigger: feature start events (e.g., free spins begins).
- Respin / near-miss: only if it is a true state transition, not an animation.
- Compute point estimate:
- Hit rate = hits / eligible spins
- Trigger rate = triggers / eligible spins (or / eligible events)
- Segment before interpreting: new vs returning players, different bet sizes, different volatility modes, different currencies (real vs promo).
- Watch for dependency: cascades, multi-way pays, and persistent states make consecutive spins non-independent; interpret "1 in N" as an average, not a guarantee.
- Track distribution, not only mean: median bonus payout, percentile bands, and streak lengths (e.g., spins since last trigger) explain UX complaints better than averages.
| Metric | Formula | Inputs you must log | How to interpret |
|---|---|---|---|
| Hit rate | HR = H / S | S = eligible spins, H = spins with win > 0 (or threshold) | Cadence of "any win" feedback; relates to perceived action density. |
| Bonus trigger probability | TR = T / S | T = trigger events (feature start), S = eligible spins | Cadence of feature entries; key driver of anticipation and session pacing. |
| Expected return (RTP-style) | ER = E[payout] / E[bet] | Bet amount, base payouts, bonus payouts, feature costs (if any) | Long-run economic value; not a promise for any single session. |
Trigger Mechanisms: Design and Classification
When teams ask for slot bonus triggers explained, the key is recognizing that "trigger" is a mechanism choice, not just a probability.
Common trigger types you can mix
- Randomized (RNG) per spin: each spin independently rolls for a feature; easiest to tune, but can create streakiness.
- Symbol/event-based: collect X scatters, fill a meter, land a pattern; improves clarity and perceived agency.
- Time-based / session-based: a bonus after N minutes, daily login streak, or once per session; stabilizes cadence, but can feel "scheduled" if overused.
- Progressive pity / drought protection: probability increases with spins since last trigger; smooths extremes while keeping randomness.
- Choice-driven triggers: players opt into a feature (buy bonus, watch ad, spend tokens); shifts control and monetization dynamics.
Mini-scenarios: applying the same concepts in different situations
- Early retention (Day 0-1 feel): raise bonus frequency via meter-based progress so new users reliably see a feature; cap bonus value to protect economy while teaching rules.
- High-stakes segment: keep trigger rate stable but raise bonus value variance (bigger spread) to deliver "story moments" without flooding the game with constant features.
- Short sessions (commuter play): use a time-based guarantee (e.g., "one feature per session" logic) to prevent no-bonus sessions, then reduce average payout per feature to keep ER steady.
- Live-ops event week: add a separate event-triggered bonus with its own telemetry, so you can boost excitement temporarily without permanently changing base-game hit rate.
- Responsible UX tuning: prefer clearer, event-based triggers over opaque randomness when players misunderstand odds; it reduces "rigged" perceptions even if math is unchanged.
Expected Return: Theory and Practical Formulae

Expected return is the bridge between frequency and value. If you're building an expected return RTP calculator, start with decomposition: base game return + bonus contribution − any feature costs.
Practical formulas that teams actually use
- Decomposed expected return: ER = ERbase + ERbonus − ERcosts
- Bonus contribution (simple): ERbonus ≈ TR × EVbonus / AvgBet
- TR = triggers per spin
- EVbonus = average bonus payout per trigger (in coins)
- AvgBet = average wager per spin (in coins)
- Multiple bonus types: ERbonus ≈ Σ (TRi × EVi / AvgBet)
Limits and pitfalls to call out explicitly
- Expectation is not experience: the mean can be constant while players feel worse due to increased variance or longer droughts.
- Conditional value shifts: EVbonus depends on bet size, persistent states, and entry conditions (e.g., "meter almost full" players differ from others).
- Non-independence: cascades and multi-stage bonuses create correlated payouts; use simulation for final validation, not only closed-form math.
- Denominator drift: if promo spins have different payouts or costs, mixing them into ER without labeling will distort decisions.
Worked examples: concept → numbers → product decision
-
Keeping return constant while changing cadence
If TR = 0.01 triggers/spin (about 1 in 100) and EVbonus = 50×bet, then bonus contribution ≈ 0.01 × 50 = 0.5×bet per spin. If you double frequency to TR = 0.02, to keep the same contribution you'd target EVbonus ≈ 25×bet. Product implication: more frequent excitement, smaller average feature outcomes. -
Diagnosing "feels stingy" despite stable ER
Suppose ER stays unchanged, but you moved value into rarer big wins: TR decreases and EVbonus increases proportionally. Players with short sessions may miss features entirely. Product implication: add drought protection or a meter-based trigger while slightly lowering top-end payouts to preserve ER.
Design Trade-offs: Balancing Frequency, Value, and User Experience
- Myth: higher hit rate always means better. A higher hit rate with tiny wins can feel like noise; define "meaningful hit rate" (win ≥ threshold) alongside any-win hit rate.
- Mistake: optimizing only the average bonus payout. EV can rise while median drops; players judge typical outcomes, not just the mean.
- Mistake: comparing games by "best slots with frequent bonuses" language alone. "Frequent" must specify the unit (per spin/session) and the trigger definition (any feature vs a specific premium feature).
- Mistake: mixing trigger sources. If you add time-based guarantees, separate them from RNG triggers in analytics or your tuning loop will chase phantom changes.
- Mistake: ignoring bet-size elasticity. If EV scales nonlinearly with bet, your frequency/value balance shifts across segments and can break fairness expectations.
Implementation & Monitoring: Experiments, Instrumentation, and Dashboards
Event schema checklist (minimum viable)
- spin_resolved: user_id, session_id, bet, base_payout, eligible=true/false, state_id
- hit: spin_id, win_amount, win_category (any-win, meaningful-win)
- bonus_triggered: spin_id or event_id, bonus_type, trigger_source (rng, meter, time), entry_state
- bonus_finished: bonus_type, total_bonus_payout, steps_count, max_multiplier (if relevant)
A/B experiment guardrails
- Change one primary lever: TR or EVbonus, not both at once, unless you are explicitly testing a bundle.
- Define success as a vector: retention proxy, ARPDAU proxy, complaint rate proxy, and economy stability (sink/source balance).
- Monitor drought distribution: spins since last trigger percentiles; this often predicts sentiment better than mean trigger rate.
Mini-case: adding drought protection without changing long-run return
Goal: reduce extreme no-bonus streaks in Thailand traffic during short sessions while keeping expected return stable.
- Implement a soft pity counter that increases trigger chance after a threshold of no-trigger spins.
- Reduce EVbonus slightly (e.g., via lower average multipliers) to offset any increase in realized trigger frequency.
- Validate via simulation + live telemetry: TR overall, TR by session length, and bonus payout distribution.
// Pseudocode (conceptual)
if (spins_since_bonus < N) {
  p = p_base;
} else {
  p = min(p_cap, p_base + k * (spins_since_bonus - N));
}
if (rand() < p) trigger_bonus();
Practical Clarifications from the Field
Is hit rate the same as bonus frequency?
No. Hit rate counts spins with wins (per your definition), while bonus frequency counts how often a specific feature triggers. A game can have a high hit rate and still have rare bonuses.
What's the simplest way to explain "1 in N" triggers to stakeholders?
It's an average over many spins, not a schedule. Players can still experience streaks unless you add drought protection or deterministic progress.
How do I choose the denominator for trigger rate?
Use only eligible opportunities: spins or events where the trigger could actually occur. If a state blocks triggers, exclude those spins or you will understate the true probability.
Can I keep expected return constant while making bonuses more frequent?
Yes, by lowering average bonus value so TR × EV stays roughly constant. Verify with simulation because stateful features and bet distributions can break the simple proportional relationship.
Why do players say a game is "cold" even when ER is unchanged?
They feel droughts and typical outcomes, not the long-run average. Track time-to-trigger percentiles and median bonus payouts alongside ER.
Do time-based guarantees count as "rigged" mechanics?
Not inherently; they are a design choice. The risk is opacity-if guarantees exist, ensure messaging and analytics segmentation distinguish them from RNG triggers.
What should I log to debug bonus value shifts?
Log entry conditions (meter level, bet size, state) and the full bonus payout breakdown. Average value alone hides whether changes come from fewer steps, lower multipliers, or different player mix.