
Short sessions (or brief measurement windows) often underestimate real variance and distort uncertainty because user behavior is temporally dependent: what happens in minute 1 is not independent of minute 10 or of tomorrow's traffic mix. The result is overconfident decisions, unstable A/B outcomes, and misleading "significance" that disappears once you measure longer.
Why brief measurement windows bias variance estimates
- They truncate slow behaviors (returns, retries, delayed conversions), shrinking observed spread.
- They amplify burstiness (campaign spikes, outages), inflating or deflating variance unpredictably.
- They ignore correlation within users and within time blocks, breaking independence assumptions.
- They over-weight "fast" users and under-weight "slow" users, changing the effective population.
- They push teams to chase noisy wins using a statistical significance calculator on incomplete data.
Statistical foundations: variance, sampling error and temporal dependence
This guidance fits product and growth teams running experiments or monitoring KPIs where user actions unfold over minutes to days (common in Thailand's mobile-first traffic and campaign-driven peaks). It is especially relevant when metrics have delays (conversion, retention, revenue) or when you segment heavily.
Do not apply these steps blindly when your metric is truly instantaneous and memoryless (rare), when instrumentation is incomplete, or when the analysis unit is wrong (e.g., mixing session-level and user-level decisions). If you cannot link events to stable user identifiers, focus on logging fixes before modeling variance.
How session length skews observed variability in practice
You will need:
- Access to raw event logs with timestamps, user_id (or device_id), session_id, and experiment assignment.
- Ability to re-aggregate metrics at different windows (e.g., first 2 minutes vs full session vs 24 hours).
- An experiment analytics platform (or warehouse + notebook) that supports reweighting/segmentation and robust aggregations.
- Basic product analytics tools to inspect funnels, event lag distributions, and missingness.
- Optional: cohort analysis software to compare "fast vs slow" converters and returning users over time.
- If you run tests: A/B testing software that enforces consistent assignment and prevents mid-test switching.
Typical failure modes: overconfidence, Simpson-like artifacts and selection bias
- Risk of false certainty: short windows can make confidence intervals look tight while being systematically wrong.
- Risk of time-mix confounding: daypart, weekends, and campaign bursts can dominate outcomes in a narrow window.
- Risk of non-representative users: only "quick" users appear, biasing both mean and variance.
- Risk of repeated looks: checking results hourly increases the chance you stop on noise.
-
Define the decision unit and the full outcome horizon
Decide whether decisions are made per user, per session, or per order-and pick the horizon over which the outcome is meaningfully complete (e.g., "within 24 hours of first exposure"). Short sessions are fine only if the metric fully resolves within that window.
- Rule: if outcomes arrive later (returns, retries, delayed payments), session-only variance is not the variance you care about.
-
Measure "time-to-event" and "time-to-stability" for your metric
Plot event lag: time from exposure to the metric's contributing events (purchase, signup completion, support contact). If the distribution has a long tail, short windows will systematically miss tail outcomes and understate variability.
- Diagnostic: compare metric value using 5-min, full-session, and 24-hour attribution; large shifts indicate window bias.
-
Recompute variance under multiple windows and compare rankings
Compute variance (and CI widths) for each variant under increasing windows. If variant ranking flips or CI widths expand materially as the window grows, the short window was not trustworthy.
- Practical: run the same aggregation in your experiment analytics platform for windowed datasets.
-
Check for Simpson-like artifacts via stratification
Split by time (daypart), acquisition channel, and device/network class; short windows often over-represent certain strata. If within-stratum effects differ from the overall effect, you are likely seeing composition bias.
- Use cohort analysis software to track how cohorts behave beyond the initial session.
-
Quantify selection bias from "short-session survivors"
Compare users who have only one short session vs those who return or have long sessions. If the metric differs strongly between groups, then measuring only short sessions changes the population and distorts variance.
- Diagnostic: compute propensity of being "short-session-only" and see if it differs by variant.
-
Stress-test with conservative assumptions before acting
Before shipping, assume the missing tail behaves worse than observed (worst-case check) and see if the decision still holds. This is a safety valve when you must decide quickly.
- Avoid relying on a statistical significance calculator alone; it cannot fix window-induced bias.
Experiment and logging design to capture true variability
- Log exposure timestamp and variant assignment once, and reuse it for all downstream events (avoid re-assignment on refresh).
- Store stable identifiers (user_id where possible) and link sessions to users to capture within-user dependence.
- Record session boundaries consistently (idle timeout rules) and version them when they change.
- Track event-time and ingestion-time separately to detect delays and backfills.
- Include "first seen" and "returning" flags to separate novelty effects from steady-state behavior.
- Capture channel and campaign parameters; short windows are highly sensitive to traffic mix shifts.
- Predefine the outcome horizon (e.g., 24h/7d) and keep it fixed across variants and reruns.
- Validate that missing events (crashes, offline) are not variant-dependent.
- Document metric definitions inside your A/B testing software and lock them for the test duration.
Analytical fixes: bootstrapping, hierarchical models and robust estimators
- Mistake: treating session rows as independent when many belong to the same user. Fix: aggregate to user first or use clustered/robust SEs.
- Mistake: using a short-window mean with long-horizon decisions (e.g., retention). Fix: align estimator horizon to the decision horizon.
- Mistake: bootstrapping at the event level. Fix: bootstrap at the user level (or at the highest independent unit).
- Mistake: ignoring day-to-day dependence and seasonality. Fix: block bootstrap by day or model time effects.
- Mistake: relying on fragile variance estimators for heavy-tailed metrics (revenue). Fix: winsorize/trim with a pre-registered rule or use robust estimators (median-of-means).
- Mistake: hierarchical models without checking identifiability. Fix: start simple (random intercept by user/cluster), run posterior predictive checks, and compare to non-model diagnostics.
- Mistake: p-hacking via repeated looks. Fix: use sequential testing methods or commit to fixed checkpoints.
- Mistake: over-segmentation with tiny samples. Fix: shrinkage (hierarchical pooling) or fewer, decision-relevant segments.
Decision-making under risk: thresholds, worst-case checks and reporting
- Delay the decision and extend the window: best when the cost of waiting is low and the metric has known lag/tails.
- Ship behind a guardrail with staged rollout: suitable when you need speed; monitor long-horizon metrics while limiting blast radius.
- Decide using conservative bounds (worst-case tail): appropriate when tail outcomes are missing and downside risk is asymmetric.
- Switch the primary metric to an earlier, validated proxy: only when you have evidence the proxy predicts the long-term outcome and you keep long-term checks in reporting.
In reporting, state the measurement window, the analysis unit (user vs session), dependence assumptions, and whether results are stable across windows. If you used product analytics tools for diagnostics, include screenshots/exports of lag distributions and window-sensitivity checks.
Concise answers on dealing with short sessions and variability
When is a short session window acceptable?
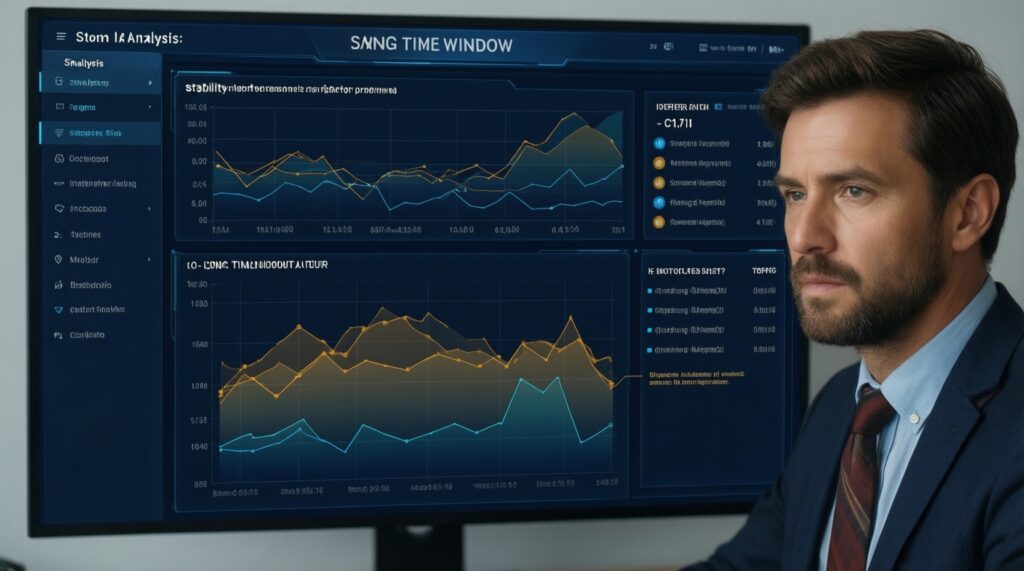
Only when the metric fully resolves within that window and user behavior has minimal dependence beyond it. You still need to verify stability by comparing at least one longer window.
Why does my variance look smaller in short sessions?
You are likely truncating slow outcomes and excluding returning behavior, which removes part of the natural spread. This creates an artificially "clean" dataset with biased variance.
Can I trust a statistical significance calculator for short-window results?
Not by itself. A calculator assumes your estimator is unbiased for the target outcome; short windows often violate that assumption even if the p-value is small.
What should I configure in A/B testing software to reduce window bias?
Lock assignment at first exposure, prevent cross-variant contamination, and standardize attribution rules. Ensure exposure and downstream events are consistently linked.
How do I detect Simpson-like artifacts quickly?
Stratify by time, channel, and device/network, then compare within-stratum effects to the aggregate. If conclusions change, the short window is likely mixing different populations.
Is an experiment analytics platform enough, or do I need modeling?
Start with window-sensitivity diagnostics and correct aggregation (user-level, clustered SEs). Add bootstrapping or hierarchical models when dependence and heavy tails materially affect decisions.
Where does cohort analysis software help most here?
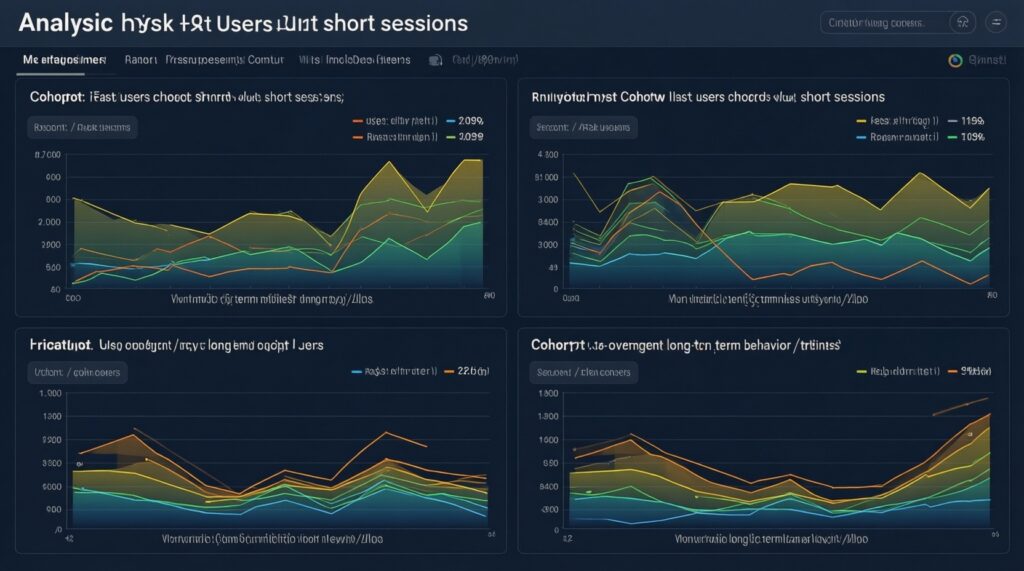
It reveals whether "fast" users dominate short windows and whether longer-horizon behavior diverges by cohort. This directly diagnoses selection bias from brief sessions.