
A slot paytable is the rulebook that links symbol combinations to payouts and, indirectly, to expected return. By reading the paytable alongside reels, paylines, and feature multipliers, you can infer how often wins can occur, how big they can get, and why two games with similar themes can behave very differently in practice.
Core concepts at a glance
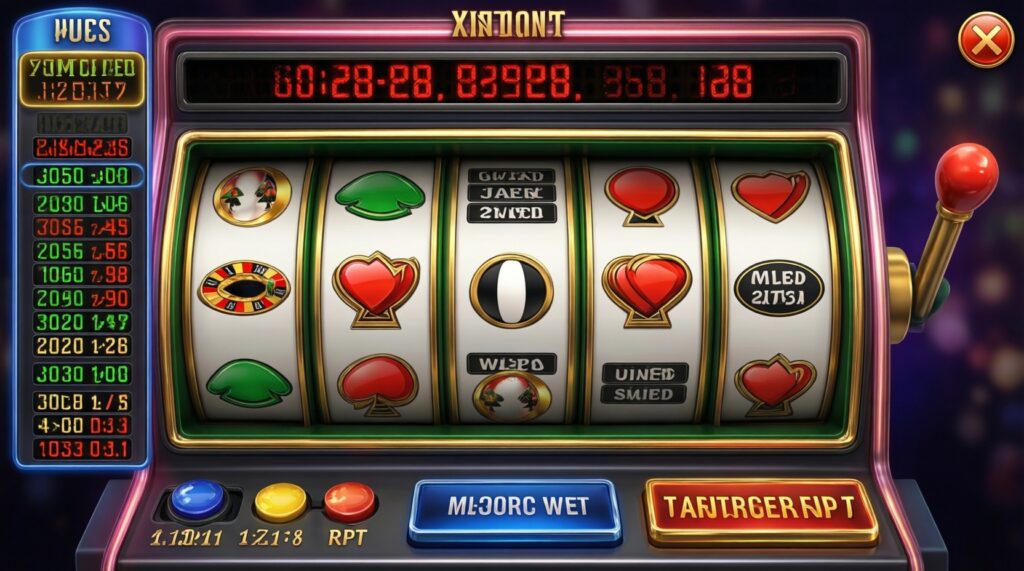
- A paytable describes what pays (symbols, counts, special rules), not how often it pays.
- Symbol frequency is driven by reel weighting (virtual stops), which the paytable rarely shows directly.
- Total payout depends on bet model: per-line vs all-ways, plus wilds, scatters, and multipliers.
- RTP is the long-run average return; it is shaped by both base-game and bonus distributions.
- Volatility is about payout distribution: how returns cluster into many small wins vs rare big hits.
- With limited resources, you can still audit a game using a screenshot paytable, a small spin log, and a spreadsheet.
How paytables define symbol frequency and reel weighting
A paytable defines the payout mapping: "if a valid winning pattern occurs, pay X times the line/total bet." This is the core of a slot paytable explained in practical terms: it tells you the prize schedule for symbols, wild substitutions, scatters, and feature triggers.
What it usually does not reveal is symbol frequency. Modern slots often use virtual reels (weighted stops): each physical reel position can represent many hidden stops, making some symbols far more common than others. The paytable can hint at weighting (for example, very high payouts for a symbol typically imply lower appearance frequency), but it cannot confirm it.
Boundary to keep clear: the paytable is not a probability table. Two games can publish the same looking paytable while using different reel strips, different bonus trigger rates, or different feature weighting, resulting in noticeably different hit rate and volatility.
Calculating payouts: single-line wins, paylines and bonus multipliers
To correctly compute outcomes, treat the paytable as a function that consumes (a) a bet definition and (b) a win pattern. This is where most confusion about slot symbol payouts and paylines comes from: the same symbol count can pay differently depending on the line model.
- Identify the bet basis. Is the paytable quoted as "x line bet" (per payline) or "x total bet" (per spin)? Online titles vary; an online slot payout table often states this explicitly in the help screen.
- Determine the win model. Common models:
- Paylines: wins must land on active lines from left to right (usually).
- All-ways / ways-to-win: any position on each reel counts, multiplying combinations.
- Cluster pays: adjacent groups trigger payouts (not line-based).
- Resolve wild rules. Wilds may substitute for regular symbols, may stack, and may carry multipliers (e.g., 2x/3x). Some wilds do not substitute for scatters or bonus symbols-check the paytable text.
- Apply the base payout. Typical line-based formula:
Payout = (Paytable multiplier for symbol count) × (Line bet) × (Any win multiplier)
- Handle multiple wins. In one spin you can have:
- multiple line wins added together (paylines),
- multiple ways counted separately (all-ways),
- cascades/avalanches where each drop is a new evaluation.
- Apply bonus/free-spin multipliers last. Many games multiply the total win at the end of a feature; others multiply per cascade or per line. The paytable wording matters.
Worked micro-example (line-based)

Suppose a paytable says "4 of Symbol A pays 20x line bet," your line bet is 1 THB, and a wild multiplier of 2x applies to that line win. Then the line win is: 20 × 1 × 2 = 40 THB. If the spin has three winning lines, you sum each line's computed win.
RTP mechanics: converting paytable parameters into expected return
In practice, you rarely have enough data to compute exact RTP from a paytable because reel weighting and feature odds are hidden. Still, the paytable is central to understanding slot machine paytable and RTP because it defines the size of payouts that the underlying probabilities are "feeding." Use it in these scenarios:
- Comparing two games with similar RTP claims. If both advertise high return, the paytable can reveal whether the return is delivered through frequent small wins (lower top prizes) or through rare spikes (large top prizes).
- Assessing base-game vs bonus contribution. If the paytable heavily concentrates large multipliers inside a bonus, the base game may feel "dry" even when long-run RTP is competitive.
- Sanity-checking a "high RTP slots paytable" claim. A high RTP label without clear feature rules can still hide extreme variance. Look for where the largest multipliers live: base symbols, expanding wilds, retriggers, or buy-bonus mechanics.
- Building a lightweight expected-value model (limited resources). If you can record a small spin log (e.g., 200-500 spins) and categorize outcomes by paytable bucket (0x, 0-1x, 1-5x, 5-20x, etc.), you can estimate whether results are consistent with the game's described behavior-without trying to reverse engineer exact reels.
- Choosing bet sizing for bankroll constraints. Paytable structure (max multipliers and bonus volatility) helps decide whether a smaller unit bet is safer for a fixed session budget in THB.
Compact expected-return framing (what you can and cannot compute)
- Conceptual RTP formula: RTP = Σ (Probability of outcome i × Payout multiplier i)
- What's missing: the probabilities (reel weights, feature odds). The paytable supplies the payout multipliers, which is only half of the equation.
Volatility, hit rate and variance: reading distribution outcomes
Volatility is about how returns are distributed over time. Two games can share a similar stated RTP yet feel totally different because one pays often in small amounts while the other saves most value for rare bonus spikes.
What the paytable helps you infer quickly
- Potential top-end: If the highest symbol awards are modest but bonuses stack multipliers, expect the biggest outcomes to be bonus-dependent.
- Win granularity: A dense ladder of payouts (e.g., 3/4/5-of-a-kind across many symbols) tends to support more frequent non-zero results than a sparse ladder.
- Multiplier placement: Multipliers applied to total win can create more variance than small per-line multipliers, especially with cascades.
Limitations (what you cannot conclude from the paytable alone)
- Hit rate is not published in the paytable. Symbol frequency and reel weighting dominate hit rate; the paytable only lists prizes.
- Variance cannot be derived exactly. Without full probability mapping (including feature triggers and retrigger odds), you can't compute true variance-only make informed hypotheses.
- "High prize = rare" is not a rule. Designers can tune weighting so a symbol is not as rare as its payout suggests, then compensate elsewhere (e.g., lower feature contribution).
Common paytable formats and a comparison table for analysis
Most errors happen when readers mix payout bases (line bet vs total bet) or compare different win models (paylines vs ways vs clusters). Use the table below as a structured way to read a paytable before you draw conclusions.
- Mistake: comparing "20x" across games. 20x line bet (with 20 lines) is not equivalent to 20x total bet.
- Mistake: ignoring the bet scaling rule. Some games change line bet automatically; others lock lines and scale coin value.
- Myth: the paytable shows symbol odds. It shows symbol rewards; odds are elsewhere (reels/weights).
- Myth: bigger maximum multiplier means better value. Value depends on probability; a huge max win can coexist with a low chance to reach it.
| What you see in the paytable | What it usually means | What to check next (fast audit) | Low-resource alternative |
|---|---|---|---|
| "Pays x line bet" for 3/4/5 symbols | Classic paylines; each active line is evaluated | Number of lines, whether multiple line wins stack, direction rules | Screenshot help screen + manual line-win sum in spreadsheet |
| "Pays x total bet" | Win values already normalized to the full spin wager | Whether the game is ways/cluster; how multipliers apply | Record 50-100 spins; compute win as multiple of total bet |
| Wild symbol rules (substitution, stacking, multipliers) | Wilds can change both hit rate and average win size | Does wild multiply only its line, or the whole win? Can it appear on all reels? | Create a small "rules matrix" note (wild × reel × multiplier) |
| Scatter/bonus pays and triggers | Non-line-based events; often the main volatility driver | Trigger counts, retriggers, feature multipliers, buy-bonus conditions | Log each trigger occurrence in a simple tally sheet |
| Maximum win statement | Upper bound of a rare combination of events | Which mechanics are required (full screen + multiplier + retrigger, etc.) | List prerequisites; do not treat max win as typical outcome |
Applying paytable analysis: worked examples and audit checklist
This workflow converts a paytable into a practical "behavior profile" you can compare across games, even if you don't have access to reels or math sheets.
Mini-case: building a quick profile from a paytable
- Normalize the unit. Write down whether payouts are per line bet or total bet.
- Extract the payout ladder. For each paying symbol, note the 3/4/5-of-a-kind multipliers (or cluster thresholds).
- Mark value concentrators. Circle anything that can multiply wins (wild multipliers, end-of-feature multipliers, escalating multipliers).
- Separate base vs feature. List what can happen in the base game (line wins, scatters paying, small multipliers) vs in bonuses (free spins, expanding wilds, big multipliers).
- Decide what to measure next. If you can't access probabilities, measure outcomes: % of zero-win spins, typical win size when you do win, and how much of the session return comes from bonuses.
Short worked calculation: comparing two payout ladders (no hidden odds)
If Game A pays 10x total bet for its common top symbol (5-of-a-kind) while Game B pays 40x total bet for its common top symbol, you still cannot say B returns more. You can say B's base-game top symbol win is larger in magnitude, which may increase volatility if frequencies are similar.
Audit checklist for limited resources (spreadsheet-friendly)
- Capture the entire paytable (screenshots) including footnotes on multipliers and directions.
- Write a one-line "bet basis" note: line bet or total bet.
- Log a small sample of spins and record each outcome as a multiple of total bet (0x, 0.2x, 1x, 5x, etc.).
- Tag each non-zero win as base or feature, based on paytable rules.
- Check for rule interactions that change results: stacked wilds, multipliers on cascades, capped wins, or minimum win guarantees.
- When comparing games, only compare like-for-like: same bet basis and same win model family (paylines vs ways vs clusters).
Practical clarifications and quick answers
Where do I find the paytable in an online slot?
Open the game's help/info menu; the paytable is usually the symbol page plus a rules page for wilds, scatters, paylines/ways, and feature mechanics.
Does a higher symbol payout mean the symbol is rarer?
Often, but not reliably. Frequency is controlled by reel weighting and feature design, which the paytable typically does not disclose.
What's the difference between "per line bet" and "per total bet" payouts?
Per line bet payouts must be multiplied by the line bet (and you can have multiple lines winning). Per total bet payouts are already normalized to the full spin wager.
Can I calculate RTP from the paytable alone?
Not exactly, because you need probabilities for each outcome (reel strips/weights and feature odds). You can still use the paytable to understand where value and volatility are concentrated.
How do paylines affect my actual win amount?
Paylines determine how many independent win evaluations happen per spin and which patterns qualify. More lines can produce more simultaneous small wins, but the bet is usually spread across lines.
What should I look for if I want steadier sessions?

Prefer paytables with more mid-tier payouts in the base game and fewer "all value is in the bonus" structures. Also watch for large feature multipliers that can dominate returns.